Unlock a world of possibilities! Login now and discover the exclusive benefits awaiting you.
- Qlik Community
- :
- All Forums
- :
- QlikView App Dev
- :
- Re: Stores Performance Map?
- Subscribe to RSS Feed
- Mark Topic as New
- Mark Topic as Read
- Float this Topic for Current User
- Bookmark
- Subscribe
- Mute
- Printer Friendly Page
- Mark as New
- Bookmark
- Subscribe
- Mute
- Subscribe to RSS Feed
- Permalink
- Report Inappropriate Content
Stores Performance Map?
Hello guys,
I have got a map, ( which is an image .png) 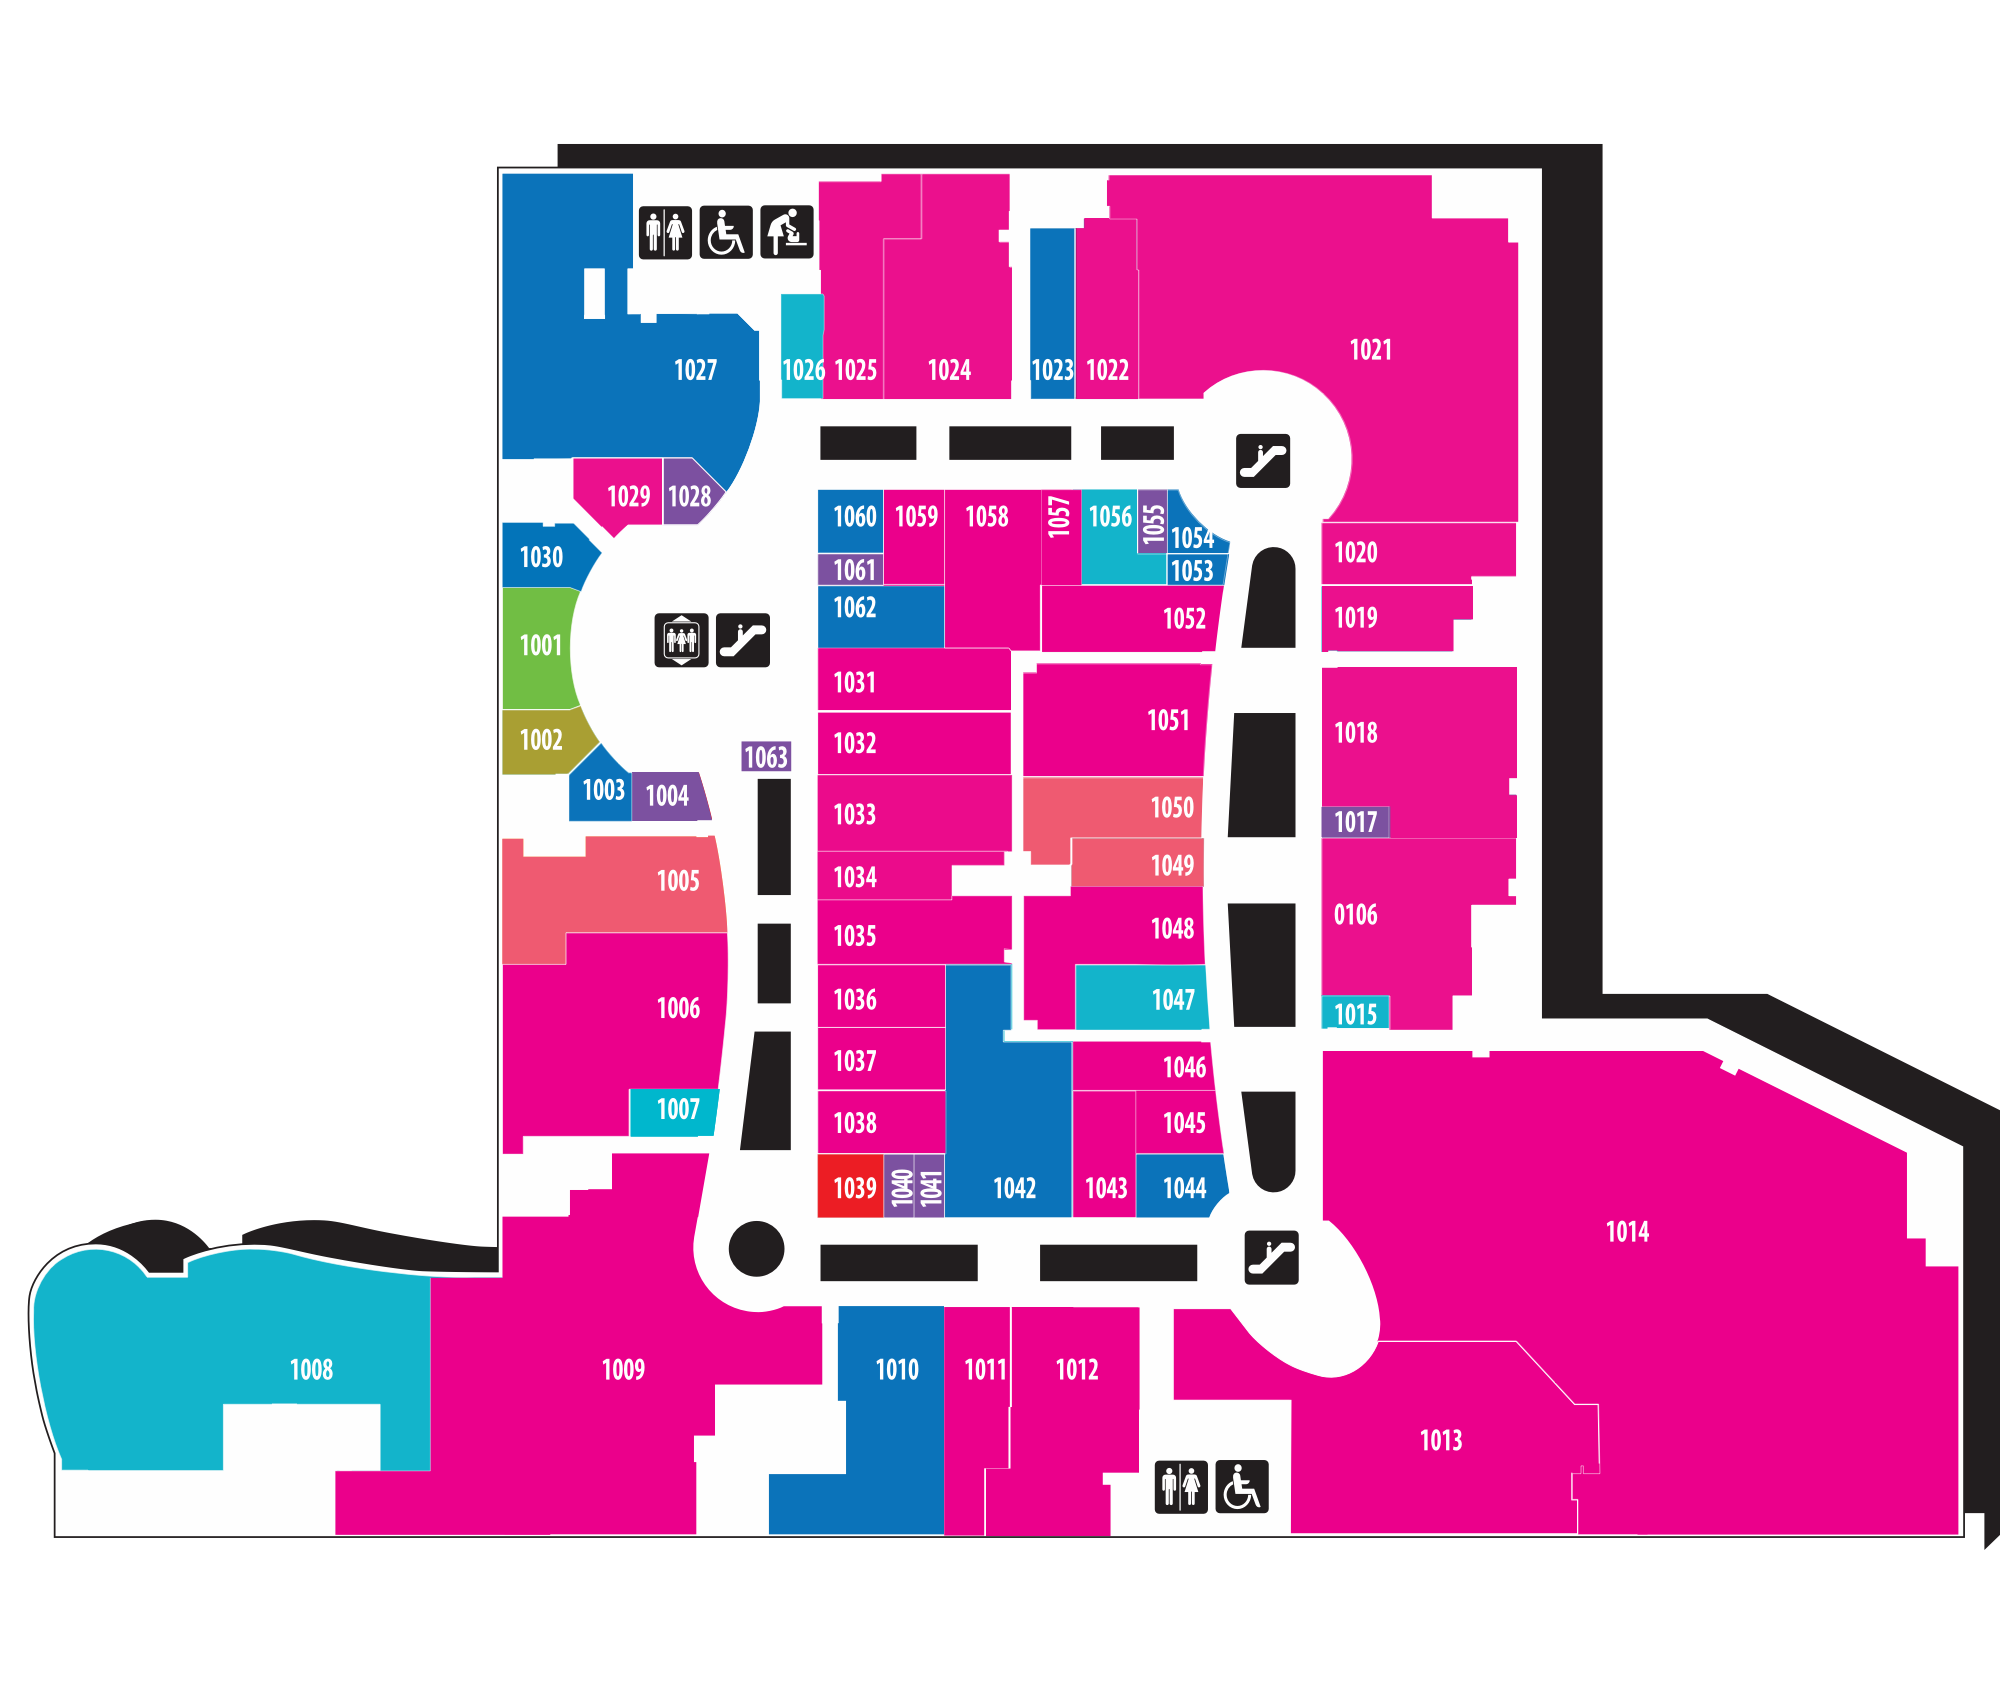
And it shows me how the Mall is structured, and all the corresponding shops.
IF i make a Random generator for stores from 1001 to 1063( the stores in the map)
and then I make a Random generator for Sales of stores from 1001 to 1063,
How to show how much sales each store has, on the map?
-Thanks
- « Previous Replies
-
- 1
- 2
- Next Replies »
Accepted Solutions
- Mark as New
- Bookmark
- Subscribe
- Mute
- Subscribe to RSS Feed
- Permalink
- Report Inappropriate Content
You could use this image as a background image in a scatter chart, create your own coordinate system that links image positions to stores and use stores as dimension and your coordinates as x/y expressions.
You can use an expression for z (bubble size) to indicate your sales.
There are some examples here that show how to do that, search for 'google maps' or similar here in the forum.
- Mark as New
- Bookmark
- Subscribe
- Mute
- Subscribe to RSS Feed
- Permalink
- Report Inappropriate Content
I have seen something like this a few years ago by a presentation from the qlik partner Transact with the tool QlikMap which is based on Openstreetmap:
Transact erweitert QlikView mit dem neuen Modul QlikMap 4.1 um die räumliche Dimension
- Marcus
- Mark as New
- Bookmark
- Subscribe
- Mute
- Subscribe to RSS Feed
- Permalink
- Report Inappropriate Content
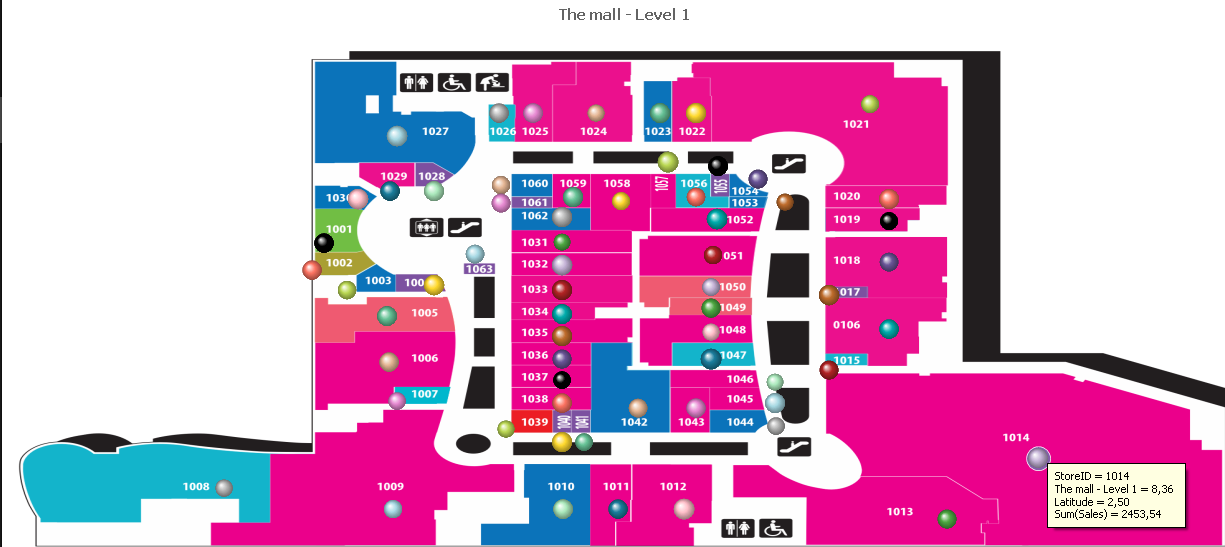
this is what I made,
I loaded the Mall map, and i made Points for every store,
Now I have to fill data for every store
- Mark as New
- Bookmark
- Subscribe
- Mute
- Subscribe to RSS Feed
- Permalink
- Report Inappropriate Content
Maybe like
LOAD
Recno()+1000 as StoreID,
Ceil(RAND()*10000) as Revenue
Autogenerate 63;
- Mark as New
- Bookmark
- Subscribe
- Mute
- Subscribe to RSS Feed
- Permalink
- Report Inappropriate Content
It looked already quite good. If you follow the suggestion from Stefan and adjusting the size and maybe the color of the bubbles you should get the information which you want. Further if you could faint a bit the color of the map it would increase the readability of the bubbles.
- Marcus
- Mark as New
- Bookmark
- Subscribe
- Mute
- Subscribe to RSS Feed
- Permalink
- Report Inappropriate Content
Yep, Thanks 🙂
This is exactly what I was looking for .
Now do you think it's possible if I reload the application, Make a Table box with StoreId and Revenue - Export it to excel, and then repeat the same 12 times, to get the values for 12 months?
- Mark as New
- Bookmark
- Subscribe
- Mute
- Subscribe to RSS Feed
- Permalink
- Report Inappropriate Content
Thanks 
- Mark as New
- Bookmark
- Subscribe
- Mute
- Subscribe to RSS Feed
- Permalink
- Report Inappropriate Content
Theoretically, yes, it's possible, but it's much easier to do it in the script, like
LOAD *,
Ceil(RAND()*10000) as Revenue,
Monthname(Makedate(2016,iterno())) as YearMonth
While iterno() <=12;
LOAD
Recno()+1000 as StoreID
Autogenerate 63;
- Mark as New
- Bookmark
- Subscribe
- Mute
- Subscribe to RSS Feed
- Permalink
- Report Inappropriate Content
Thanks, This is way more useful
- « Previous Replies
-
- 1
- 2
- Next Replies »