Unlock a world of possibilities! Login now and discover the exclusive benefits awaiting you.
- Qlik Community
- :
- All Forums
- :
- QlikView App Dev
- :
- Straight Table?
- Subscribe to RSS Feed
- Mark Topic as New
- Mark Topic as Read
- Float this Topic for Current User
- Bookmark
- Subscribe
- Mute
- Printer Friendly Page
- Mark as New
- Bookmark
- Subscribe
- Mute
- Subscribe to RSS Feed
- Permalink
- Report Inappropriate Content
Straight Table?
Hi Everyone,
I have a requirement where i need to load the variables and show the difference between two variables in starlight table.
PFA, which has example data and explains the requirement.
Data;
load * inline [
Region, Sales, Year
NYC, 100, 2017
NYC, 200, 2018
NJ, 300, 2018
NJ, 400, 2017
CA, 500, 2018
CA, 600, 2017
SA, 700, 2018
SA, 800, 2017
FL, 900, 2018
FL, 250, 2017];
Variables:
| v_Sales2018 | =Sum({<Year={2018}>}Sales) |
| v_Sales2017 | =Sum({<Year={2017}>}Sales) |
| v_NYC2018 | =sum({<Region={'NYC'},Year={'2018'}>}Sales) |
| v_NYC2017 | =sum({<Region={'NYC'},Year={'2017'}>}Sales) |
| v_NYCFL2018 | =sum({<Region={'NYC','FL'},Year={'2018'}>}Sales) |
| v_NYCFL2017 | =sum({<Region={'NYC','FL'},Year={'2017'}>}Sales) |
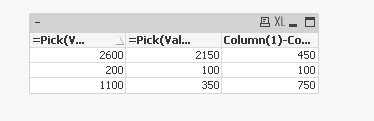
Straight table should be like below:
CoulmnA ColumnB ColumnC(difference between variables)
2600 2150 450 .... which is vSales2018-vSales2017
200 100 100 .... which is v_NYC2018-v_NYC2017
1100 350 750 .... which is v_NYCFL2018-v_NYCFL2017
Can anyone please help me understand and give any possible solution.
Thanks
Accepted Solutions
- Mark as New
- Bookmark
- Subscribe
- Mute
- Subscribe to RSS Feed
- Permalink
- Report Inappropriate Content
- Mark as New
- Bookmark
- Subscribe
- Mute
- Subscribe to RSS Feed
- Permalink
- Report Inappropriate Content
Like this?