Unlock a world of possibilities! Login now and discover the exclusive benefits awaiting you.
- Qlik Community
- :
- All Forums
- :
- QlikView App Dev
- :
- Subtotal headings
- Subscribe to RSS Feed
- Mark Topic as New
- Mark Topic as Read
- Float this Topic for Current User
- Bookmark
- Subscribe
- Mute
- Printer Friendly Page
- Mark as New
- Bookmark
- Subscribe
- Mute
- Subscribe to RSS Feed
- Permalink
- Report Inappropriate Content
Subtotal headings
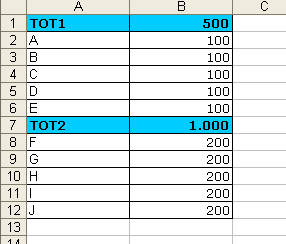
I am trying to make a table, which looks like the example in the attachment:
I have also included an example of the data. Basically I am trying to include subtotals, which I would like to lay out.
Thanks!!
 \
\
Accepted Solutions
- Mark as New
- Bookmark
- Subscribe
- Mute
- Subscribe to RSS Feed
- Permalink
- Report Inappropriate Content
Wouty,
You need to have to have at least 2 Dimensions and Pivot table for such presentation.
Once you have made chart, just go to properties ---Presentation (Just below Dimensions)
Here check box for Partial Sum for desired Dimension and Give name of Subtotal.
Regard
- Mark as New
- Bookmark
- Subscribe
- Mute
- Subscribe to RSS Feed
- Permalink
- Report Inappropriate Content
Expand the expression (by clicking the '+' sign in front of it) in your qlikview table to edit e.g. the background color. Here you can use the fact that the rowno() propertie of (sub)totals is 0.
=if(rowno()=0,rgb(0,0,255),...)
- Mark as New
- Bookmark
- Subscribe
- Mute
- Subscribe to RSS Feed
- Permalink
- Report Inappropriate Content
Wouty,
You need to have to have at least 2 Dimensions and Pivot table for such presentation.
Once you have made chart, just go to properties ---Presentation (Just below Dimensions)
Here check box for Partial Sum for desired Dimension and Give name of Subtotal.
Regard
- Mark as New
- Bookmark
- Subscribe
- Mute
- Subscribe to RSS Feed
- Permalink
- Report Inappropriate Content
nice! I overlooked partial sum!
- Mark as New
- Bookmark
- Subscribe
- Mute
- Subscribe to RSS Feed
- Permalink
- Report Inappropriate Content
You can use a mapping dimension that will work like this:
sales:
Load * inline [
SalesMan, Value
A, 10
B, 15
C, 30
D, 40
];
report_formatting:
Load * inline [
Report, SalesMan
A, A
B, B
C, C
D, D
Total, A
Total, B
Total, C
Total, D
];
In your chart you can use the "Report" dimension and then make the configuration suggested above by Stigchel
Regards,
Fernando