Unlock a world of possibilities! Login now and discover the exclusive benefits awaiting you.
- Qlik Community
- :
- All Forums
- :
- QlikView App Dev
- :
- Re: Subtotals on TOP doesn't work properly
- Subscribe to RSS Feed
- Mark Topic as New
- Mark Topic as Read
- Float this Topic for Current User
- Bookmark
- Subscribe
- Mute
- Printer Friendly Page
- Mark as New
- Bookmark
- Subscribe
- Mute
- Subscribe to RSS Feed
- Permalink
- Report Inappropriate Content
Subtotals on TOP doesn't work properly
Hi,
I have a problem with subtotals in my chart, the total is not equal to the values in lines, for example in the field "Valeur forecast" the total should be 11 113 and not 12 828, I don't want to apply the expression also in the totals, how can do that ?
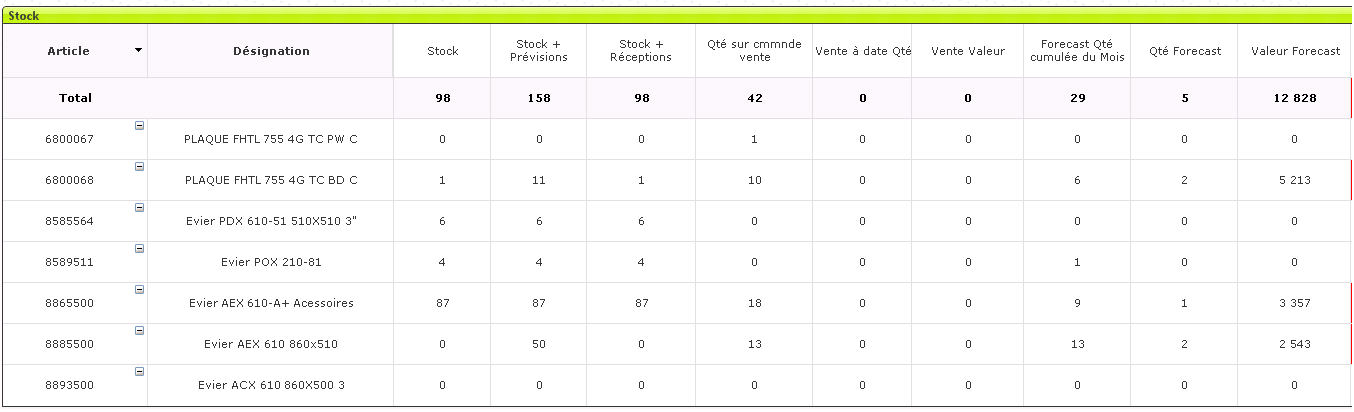
my expression is : Sum ( [Forecast.Quantity) * AVG([Budget.Average Price]).
Thanks for your help.
Accepted Solutions
- Mark as New
- Bookmark
- Subscribe
- Mute
- Subscribe to RSS Feed
- Permalink
- Report Inappropriate Content
Try this:
Sum(Aggr(Sum ( [Forecast.Quantity) * AVG([Budget.Average Price]), Article, Designation))
- Mark as New
- Bookmark
- Subscribe
- Mute
- Subscribe to RSS Feed
- Permalink
- Report Inappropriate Content
Try this:
Sum(Aggr(Sum ( [Forecast.Quantity) * AVG([Budget.Average Price]), Article, Designation))
- Mark as New
- Bookmark
- Subscribe
- Mute
- Subscribe to RSS Feed
- Permalink
- Report Inappropriate Content
Hi Sunny,
Thanks for your solution, it works but could you explain to me the expression please ?
regards,
- Mark as New
- Bookmark
- Subscribe
- Mute
- Subscribe to RSS Feed
- Permalink
- Report Inappropriate Content
Since this is a pivot table there is not an option available to use a total mode. What Aggregate is doing is creating a imaginary table as the one you have and summing its row to give the total up top. Does that make sense?
- Mark as New
- Bookmark
- Subscribe
- Mute
- Subscribe to RSS Feed
- Permalink
- Report Inappropriate Content
now I understand, Thanks.
- Mark as New
- Bookmark
- Subscribe
- Mute
- Subscribe to RSS Feed
- Permalink
- Report Inappropriate Content
No problem 
I am glad I was able to help.
Best,
Sunny
- Mark as New
- Bookmark
- Subscribe
- Mute
- Subscribe to RSS Feed
- Permalink
- Report Inappropriate Content
Subtotal/Total in Pivot Table always works as Expression Total.. so you can't have the total of Rows which is usually available in Straight Table.
Consider below simple example..
Load * Inline
[
Country, Customer
Germany, A
UK, B
France, A
UK, C
USA, D
India, E
India, D
];
Create a Straight Table
Dimension
Country
Expression
1) Count(Distinct Customer)
Total Mode = Expression Total
You will get total 5
2) Count(Distinct Customer)
Total Mode = Sum of Rows
You will get total 7
Create a Pivot Table
Dimension
Country
Expression
1) Count(Distinct Customer)
You will get total 5
In Pivot Table, by default the total mode is Expression Total.
If you want, total of rows, you need to use one of the below 2 expressions
SUM(Aggr(COUNT(DISTINCT Customer),Country))
or
IF(Dimensionality() = 0,
SUM(Aggr(COUNT(DISTINCT Customer),Country)),
COUNT(DISTINCT Customer)
)
Hope this will helps !
Happy Qliking !