Unlock a world of possibilities! Login now and discover the exclusive benefits awaiting you.
- Qlik Community
- :
- All Forums
- :
- QlikView App Dev
- :
- Re: Sum Value Based on Max/Min Period
- Subscribe to RSS Feed
- Mark Topic as New
- Mark Topic as Read
- Float this Topic for Current User
- Bookmark
- Subscribe
- Mute
- Printer Friendly Page
- Mark as New
- Bookmark
- Subscribe
- Mute
- Subscribe to RSS Feed
- Permalink
- Report Inappropriate Content
Sum Value Based on Max/Min Period
I have built the straight table at the bottom of my message. What I would like to do, is get the MIN FISCAL PERIOD sum(Sales) per COMPANY and the MAX FISCAL PERIOD sum(Sales) per Company. This would allow me to see if companies are growing or not.
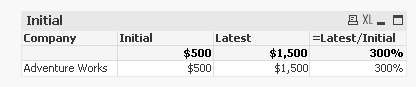
So final product would look some like:
| Company | Initial | Latest | Growth |
|---|---|---|---|
| Adventure Works | $500 | $1500 | 300% |
| Ice Cream Store | $100 | $30 | (70%) |
| Dog Store | $300 | $3000 | 1000% |
| Company | Fiscal Period | sum(Sales) |
| $395,387 | ||
| Adventure Works | Oct 2010 | $500 |
| Adventure Works | Nov 2010 | $500 |
| Adventure Works | Dec 2010 | $500 |
| Adventure Works | Jan 2011 | $500 |
| Adventure Works | Feb 2011 | $500 |
| Adventure Works | Mar 2011 | $500 |
| Adventure Works | Apr 2011 | $500 |
| Adventure Works | May 2011 | $500 |
| Adventure Works | Jun 2011 | $500 |
| Adventure Works | Jul 2011 | $500 |
| Adventure Works | Aug 2011 | $500 |
| Adventure Works | Sep 2011 | $1,000 |
| Adventure Works | Oct 2011 | $1,000 |
| Adventure Works | Nov 2011 | $1,000 |
| Adventure Works | Dec 2011 | $1,000 |
| Adventure Works | Jan 2012 | $1,500 |
| Adventure Works | Feb 2012 | $1,500 |
| Adventure Works | Mar 2012 | $1,500 |
| Adventure Works | Apr 2012 | $1,500 |
| Adventure Works | May 2012 | $1,500 |
| Adventure Works | Jun 2012 | $1,500 |
| Adventure Works | Jul 2012 | $1,500 |
| Adventure Works | Aug 2012 | $1,500 |
| Adventure Works | Sep 2012 | $1,500 |
| Adventure Works | Oct 2012 | $1,500 |
| Adventure Works | Nov 2012 | $1,500 |
| Adventure Works | Dec 2012 | $1,500 |
Accepted Solutions
- Mark as New
- Bookmark
- Subscribe
- Mute
- Subscribe to RSS Feed
- Permalink
- Report Inappropriate Content
Sunny's solution worked for your sample records, right?
What is the difference to your real data? Can you describe your data a little more?
You can add the Sales value set expression filter to both FirstSortedValue({<...>} .. ) and also to the second solution (just add it to every aggregation function)
edit:
Modifying Sunny's QVW and expressions:
=FirstSortedValue({<Sales ={">0"} >} Sales, FiscalPeriod)
=FirstSortedValue({<Sales ={">0"} >} Sales, -FiscalPeriod)
and coming back to your approach:
= sum({< MonthDate= {'$(= min({< Sales = {"> 0 "}>} MonthDate))'}>}Sales)
Set Analysis and Dollar sign expansion is only evaluated once per chart, not per dimension line, so this will not determine the min MonthDate (with Sales >0) per Company, it will filter on the overall minimum MonthDate (and you may need to double check the format of the MonthDate modifier value:
)
- Mark as New
- Bookmark
- Subscribe
- Mute
- Subscribe to RSS Feed
- Permalink
- Report Inappropriate Content
Check out the attached
- Mark as New
- Bookmark
- Subscribe
- Mute
- Subscribe to RSS Feed
- Permalink
- Report Inappropriate Content
Not showing anything when I try to apply to my qvw. Not sure what I am missing...
- Mark as New
- Bookmark
- Subscribe
- Mute
- Subscribe to RSS Feed
- Permalink
- Report Inappropriate Content
So I've figured out how to get the earliest and latest dates per company. I have a straight table setup with Company as the only dimension and these two expressions:
= min({< Sales = {"> 0 "}>} MonthDate)
= max({< Sales = {"> 0 "}>} MonthDate)
These get me the earliest dates of sale for each company but I would like the actual Sale VALUE that corresponds with these dates. Any suggestions?
- Mark as New
- Bookmark
- Subscribe
- Mute
- Subscribe to RSS Feed
- Permalink
- Report Inappropriate Content
Maybe you have multiple records for each company per month?
Try for example
=FirstSortedValue(Aggr(Sum(Sales), Company,FiscalPeriod),Aggr(FiscalPeriod,Company,FiscalPeriod))
=FirstSortedValue(Aggr(Sum(Sales), Company,FiscalPeriod),-Aggr(FiscalPeriod,Company,FiscalPeriod))
or
=Sum(Aggr( If(FiscalPeriod = Min(Total<Company> FiscalPeriod),Sales), Company,FiscalPeriod))
=Sum(Aggr( If(FiscalPeriod = Max(Total<Company> FiscalPeriod),Sales), Company,FiscalPeriod))
- Mark as New
- Bookmark
- Subscribe
- Mute
- Subscribe to RSS Feed
- Permalink
- Report Inappropriate Content
Thank you for your reply Stefan but none of those worked for me.I can guarantee there are not multiple records per company per month. Note that I have transitioned from FiscalPeriod to MonthDate
I have had success only with below to get the min or max date :
= min({< Sales = {"> 0 "}>} MonthDate)
I somehow have to work this into a set analysis expression, I took a crack at it with no luck
= sum({< MonthDate= {'$(= min({< Sales = {"> 0 "}>} MonthDate))'}>}Sales)
I feel like this is a pretty basic ask, so I dont know why I am struggling so much. You understand what I am trying to do - I just want the earliest Sales amount per company and the latest Sales amount so I can compare.
- Mark as New
- Bookmark
- Subscribe
- Mute
- Subscribe to RSS Feed
- Permalink
- Report Inappropriate Content
Sunny's solution worked for your sample records, right?
What is the difference to your real data? Can you describe your data a little more?
You can add the Sales value set expression filter to both FirstSortedValue({<...>} .. ) and also to the second solution (just add it to every aggregation function)
edit:
Modifying Sunny's QVW and expressions:
=FirstSortedValue({<Sales ={">0"} >} Sales, FiscalPeriod)
=FirstSortedValue({<Sales ={">0"} >} Sales, -FiscalPeriod)
and coming back to your approach:
= sum({< MonthDate= {'$(= min({< Sales = {"> 0 "}>} MonthDate))'}>}Sales)
Set Analysis and Dollar sign expansion is only evaluated once per chart, not per dimension line, so this will not determine the min MonthDate (with Sales >0) per Company, it will filter on the overall minimum MonthDate (and you may need to double check the format of the MonthDate modifier value:
)