Unlock a world of possibilities! Login now and discover the exclusive benefits awaiting you.
- Qlik Community
- :
- All Forums
- :
- QlikView App Dev
- :
- Re: Sum intersection
- Subscribe to RSS Feed
- Mark Topic as New
- Mark Topic as Read
- Float this Topic for Current User
- Bookmark
- Subscribe
- Mute
- Printer Friendly Page
- Mark as New
- Bookmark
- Subscribe
- Mute
- Subscribe to RSS Feed
- Permalink
- Report Inappropriate Content
Sum intersection
Hi everyone,
I have a trouble to sum intersection and union value.
For example:
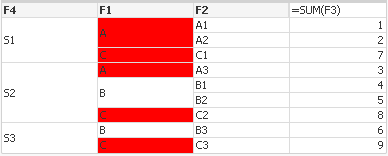
Red color is attributes for S1, then I need to sum each A and C value,
sum(A) should be 6
sum(C) should be 24

When I select null of F4, I need each value of sum(F1)
This logic is in one sheet of report, and 2 hundred million data in fact qvd.
I've tried to group by this in script, but it is too slow and has linkage issue in report when I select other dimensions
The value maybe calculated in text object and bar chart and so on.
Can anybody give me some suggestions to me?
Thanks all.
The requirement is changed...
Add sample here
- « Previous Replies
-
- 1
- 2
- Next Replies »
Accepted Solutions
- Mark as New
- Bookmark
- Subscribe
- Mute
- Subscribe to RSS Feed
- Permalink
- Report Inappropriate Content
May be this
=Count({<VENDOR=p(VENDOR),VENDOR={"=Count(DISTINCT {<COUNTRY>} COUNTRY)>1"}>}DISTINCT VENDOR)
- Mark as New
- Bookmark
- Subscribe
- Mute
- Subscribe to RSS Feed
- Permalink
- Report Inappropriate Content
May be use Aggregation like When should the Aggr() function NOT be used?
- Mark as New
- Bookmark
- Subscribe
- Mute
- Subscribe to RSS Feed
- Permalink
- Report Inappropriate Content
Hi Anil,
Thanks for your link,
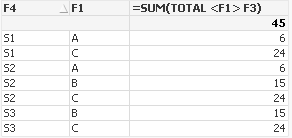
I've tried it =SUM(TOTAL <F1> F3)
but it is not what I want when select S1:


- Mark as New
- Bookmark
- Subscribe
- Mute
- Subscribe to RSS Feed
- Permalink
- Report Inappropriate Content
You mean, You want to compare row level like S1 having C which has common to all. So, You need to pick 7+8+9 ??
- Mark as New
- Bookmark
- Subscribe
- Mute
- Subscribe to RSS Feed
- Permalink
- Report Inappropriate Content
Yes, sum(C)=7+8+9, sum(A)=1+2+3
- Mark as New
- Bookmark
- Subscribe
- Mute
- Subscribe to RSS Feed
- Permalink
- Report Inappropriate Content
Can you attach your sample?
- Mark as New
- Bookmark
- Subscribe
- Mute
- Subscribe to RSS Feed
- Permalink
- Report Inappropriate Content
May be this:
=SUM(TOTAL <F1> {1} F3)* Avg(1)
- Mark as New
- Bookmark
- Subscribe
- Mute
- Subscribe to RSS Feed
- Permalink
- Report Inappropriate Content
I like your answer, It's working, but there is an issue is that when I select S1 and the total result is 45 not 30.
- Mark as New
- Bookmark
- Subscribe
- Mute
- Subscribe to RSS Feed
- Permalink
- Report Inappropriate Content
Hi Anil, I've upload demo.qvw for you, and the requirement is changed, the comment is added in qvw file. thanks.
- Mark as New
- Bookmark
- Subscribe
- Mute
- Subscribe to RSS Feed
- Permalink
- Report Inappropriate Content
May be this?
=SUM({$<COUNTRY>}QTY)
OR
=SUM({1} QTY)
- « Previous Replies
-
- 1
- 2
- Next Replies »