Unlock a world of possibilities! Login now and discover the exclusive benefits awaiting you.
- Qlik Community
- :
- All Forums
- :
- QlikView App Dev
- :
- Re: Sum of Rolling 12 months for each month, 2 lin...
- Subscribe to RSS Feed
- Mark Topic as New
- Mark Topic as Read
- Float this Topic for Current User
- Bookmark
- Subscribe
- Mute
- Printer Friendly Page
- Mark as New
- Bookmark
- Subscribe
- Mute
- Subscribe to RSS Feed
- Permalink
- Report Inappropriate Content
Sum of Rolling 12 months for each month, 2 lines for selected & previous years
Hello,
I am trying to create a line chart with:
1 line: rolling 12 months for selected year & month
2 line: rolling 12 months for the year previous to selected year
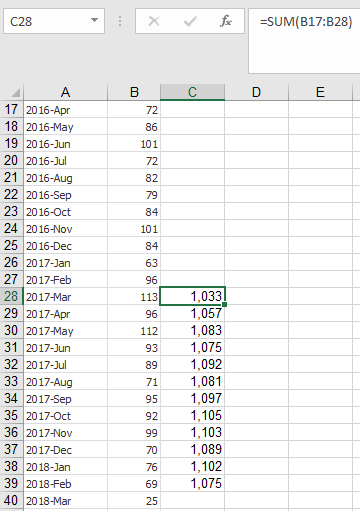
& when I say rolling, the value for each month is an accumulation of previous 12 months. Col C in the below picture is what I would like to see on the chart when I select Year=2018 & Month=Feb.
As mentioned, when I make the above selection I should have
1 line: feb 2018 to mar 2017
2 line: feb 2017 to mar 2016

- « Previous Replies
- Next Replies »
Accepted Solutions
- Mark as New
- Bookmark
- Subscribe
- Mute
- Subscribe to RSS Feed
- Permalink
- Report Inappropriate Content
You can deceive the chart label using Dual function
=Dual(Month(Year_Month), Year_Month)
- Mark as New
- Bookmark
- Subscribe
- Mute
- Subscribe to RSS Feed
- Permalink
- Report Inappropriate Content
Hi,
you will need to use Range functions, like this:
Rangesum(above(total sum(your_measure),0,12))
you can refer to the help to get familiar with the syntax
- Mark as New
- Bookmark
- Subscribe
- Mute
- Subscribe to RSS Feed
- Permalink
- Report Inappropriate Content
Hi Youssef,
I've tried it and it works for the selected period only. This expression works when the dimension is Year_Month which makes sense. But how can I get another line in the same chart for the year previous to the selected year? so, I will want it to work on Month dimension & not Year_Month. Maybe I should take another approach.
Any thoughts?
Rangesum(Above(sum({$<Year=, Month=, Week=,NumDate=}>} Number),0,12))*Avg(1)
- Mark as New
- Bookmark
- Subscribe
- Mute
- Subscribe to RSS Feed
- Permalink
- Report Inappropriate Content
can you please describe the expected ouput via a screen shot... I can't follow you on this one
- Mark as New
- Bookmark
- Subscribe
- Mute
- Subscribe to RSS Feed
- Permalink
- Report Inappropriate Content
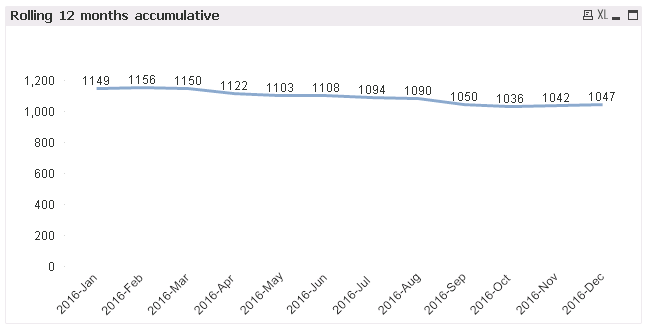
Here is what I need but in 1 chart.


- Mark as New
- Bookmark
- Subscribe
- Mute
- Subscribe to RSS Feed
- Permalink
- Report Inappropriate Content
ok it is clear now.. would you be able to share sample data ? need to make some tests in the expression
- Mark as New
- Bookmark
- Subscribe
- Mute
- Subscribe to RSS Feed
- Permalink
- Report Inappropriate Content
I have attached the data in my question above. You can use the same. That is my base data.
- Mark as New
- Bookmark
- Subscribe
- Mute
- Subscribe to RSS Feed
- Permalink
- Report Inappropriate Content
My bad.. I'll use it
- Mark as New
- Bookmark
- Subscribe
- Mute
- Subscribe to RSS Feed
- Permalink
- Report Inappropriate Content
Hi stalwar1
I'm really stuck on this one.
I tried using front end expression and AsOfTable... the problem that OP wants cumulative values (2 lines,1 line for every year, using month dimension: from 1 to 12)
after several tries, I wonder if it make sense technically..
- Mark as New
- Bookmark
- Subscribe
- Mute
- Subscribe to RSS Feed
- Permalink
- Report Inappropriate Content
Will check....
- « Previous Replies
- Next Replies »