Unlock a world of possibilities! Login now and discover the exclusive benefits awaiting you.
- Qlik Community
- :
- All Forums
- :
- QlikView App Dev
- :
- Sum of Rolling 12 months for each month, 2 lines f...
- Subscribe to RSS Feed
- Mark Topic as New
- Mark Topic as Read
- Float this Topic for Current User
- Bookmark
- Subscribe
- Mute
- Printer Friendly Page
- Mark as New
- Bookmark
- Subscribe
- Mute
- Subscribe to RSS Feed
- Permalink
- Report Inappropriate Content
Sum of Rolling 12 months for each month, 2 lines for selected & previous years
Hello,
I am trying to create a line chart with:
1 line: rolling 12 months for selected year & month
2 line: rolling 12 months for the year previous to selected year
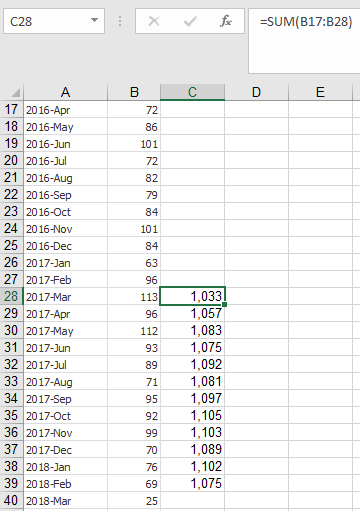
& when I say rolling, the value for each month is an accumulation of previous 12 months. Col C in the below picture is what I would like to see on the chart when I select Year=2018 & Month=Feb.
As mentioned, when I make the above selection I should have
1 line: feb 2018 to mar 2017
2 line: feb 2017 to mar 2016
- « Previous Replies
- Next Replies »
- Mark as New
- Bookmark
- Subscribe
- Mute
- Subscribe to RSS Feed
- Permalink
- Report Inappropriate Content
I guess just make use of the AsOfTable
Script
Table:
LOAD *,
Year(Year_Month) as Year,
Month(Year_Month) as Month,
1 as DataFlag;
LOAD Date(Date#(Year_Month, 'YYYY-MMM'), 'YYYY-MMM') as Year_Month,
numbers
FROM
testData.xls
(biff, embedded labels, table is Sheet1$);
Concatenate (Table)
LOAD Year_Month,
Year(Year_Month) as Year,
Month(Year_Month) as Month,
0 as DataFlag;
LOAD MonthStart(Max_Year_Month, IterNo()) as Year_Month
While MonthStart(Max_Year_Month, IterNo()) < YearStart(Max_Year_Month, 1);
LOAD Max(Year_Month) as Max_Year_Month
Resident Table;
AsOfTable:
LOAD Distinct Year_Month as AsOfYear_Month,
Year as AsOfYear,
Month as AsOfMonth,
DataFlag as AsOfDataFlag,
AddMonths(Year_Month, -IterNo() + 1) as Year_Month,
'CY' as Flag
Resident Table
While IterNo() <= 12;
Concatenate(AsOfTable)
LOAD Distinct Year_Month as AsOfYear_Month,
Year as AsOfYear,
Month as AsOfMonth,
DataFlag as AsOfDataFlag,
AddMonths(AddYears(Year_Month, -1), -IterNo() + 1) as Year_Month,
'PY' as Flag
Resident Table
While IterNo() <= 12;
Dimension
AsOfMonth
Expressions
Sum({<Flag = {'CY'}, AsOfDataFlag = {1}>}numbers)
Sum({<Flag = {'PY'}>}numbers)
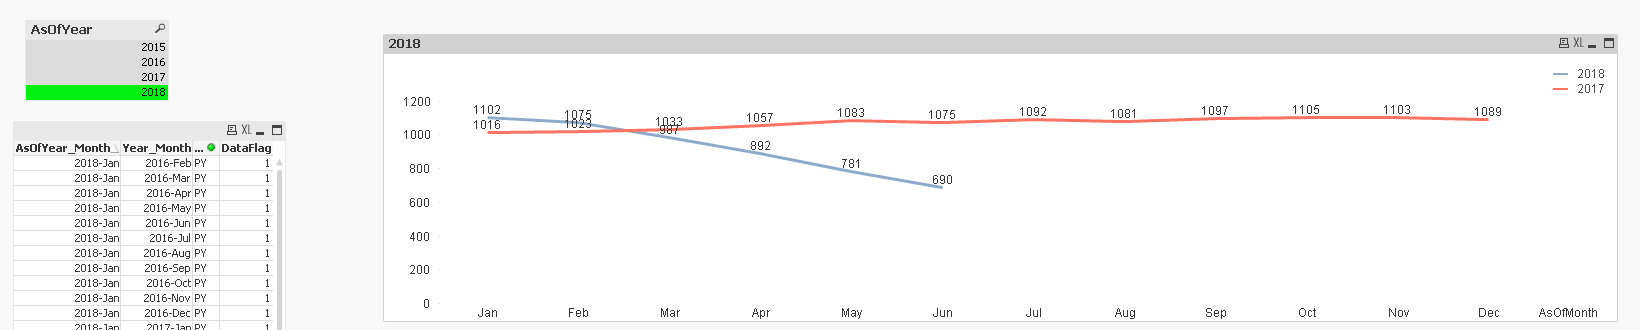
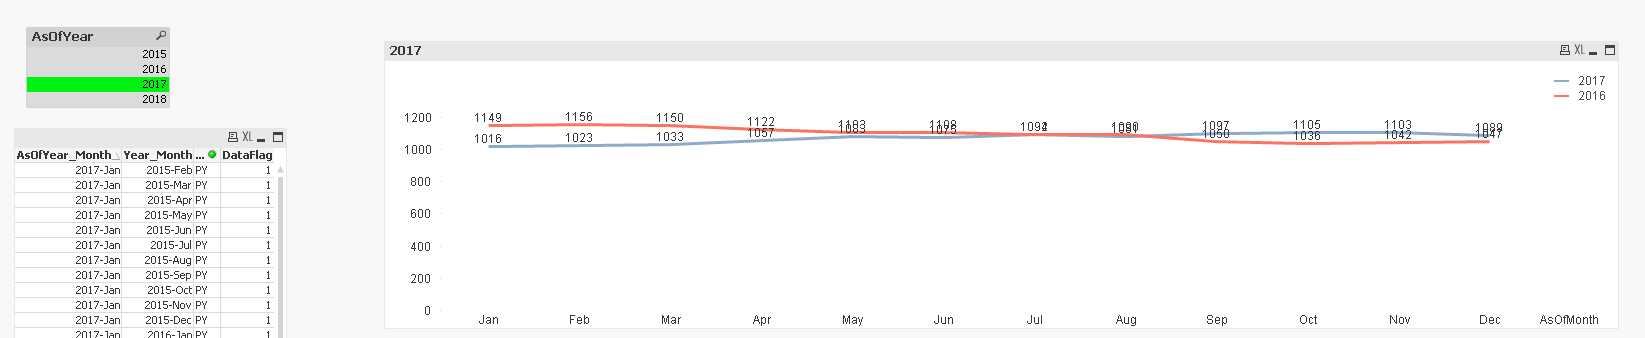
Now select in AsOfYear field....
When 2018 is selected
When 2017 is selected
- Mark as New
- Bookmark
- Subscribe
- Mute
- Subscribe to RSS Feed
- Permalink
- Report Inappropriate Content
sure, Thank you very much.
- « Previous Replies
- Next Replies »