Unlock a world of possibilities! Login now and discover the exclusive benefits awaiting you.
- Qlik Community
- :
- All Forums
- :
- QlikView
- :
- Sum of Rows in Pivot Table
- Subscribe to RSS Feed
- Mark Topic as New
- Mark Topic as Read
- Float this Topic for Current User
- Bookmark
- Subscribe
- Mute
- Printer Friendly Page
- Mark as New
- Bookmark
- Subscribe
- Mute
- Subscribe to RSS Feed
- Permalink
- Report Inappropriate Content
Sum of Rows in Pivot Table
DISCLAIMER: I have read a lot of the other solutions out there on getting the sum of rows in a pivot table. After a few hours of trying various solutions, I need to submit here to see if there is something completely unique about my requirement! I can't figure this one out!
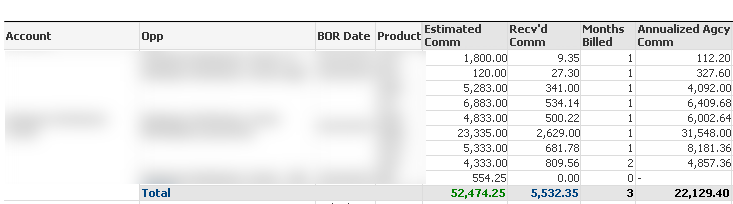
I am attempting to get an annualized commission figure based upon how much commission my company has received and how many months have been billed.
My expression for the Annualized Agcy Comm figure calculates properly BY PRODUCT, but I can't get it to total those rows. Here is my expression:
=(Sum({$<IsWon={'true'}>}ProductionCompany_AccrualBalanceCalc))
/
(Count(Distinct{$<IsWon={'true'}>}AccountingMonth))
* 12
Here is a screenshot of my dilemma:
Thank you for any help.
Accepted Solutions
- Mark as New
- Bookmark
- Subscribe
- Mute
- Subscribe to RSS Feed
- Permalink
- Report Inappropriate Content
Hi.
It's because your expression is calculated for totals regardless of dimensions, but the months count is different for each row.
Use aggr function to calculate your formula over the chart dimensions explicitly and the Sum() function to get the result.
=Sum(aggr([your expression], [chart dimension1], ...))
- Mark as New
- Bookmark
- Subscribe
- Mute
- Subscribe to RSS Feed
- Permalink
- Report Inappropriate Content
Ahhh, I had the Aggr part right, but I wasn't wrapping the whole expression in a Sum(). Problem solved!