Unlock a world of possibilities! Login now and discover the exclusive benefits awaiting you.
- Qlik Community
- :
- All Forums
- :
- QlikView App Dev
- :
- Re: Sum of Time Intervals
- Subscribe to RSS Feed
- Mark Topic as New
- Mark Topic as Read
- Float this Topic for Current User
- Bookmark
- Subscribe
- Mute
- Printer Friendly Page
- Mark as New
- Bookmark
- Subscribe
- Mute
- Subscribe to RSS Feed
- Permalink
- Report Inappropriate Content
Sum of Time Intervals
Hi All,
I am having trouble with summing up time intervals. My data has the start and end time for an employee and I have calculated the gap between the time using the Interval function.
Furthermore, each employee is also assigned a warehouse number and I am trying to sum up the gap per warehouse number. I find that the number I get is usually double the actual number that I've manually calculated on Excel, meaning there is an obvious error.
An example of the data is:
| Warehouse # | Employee # | Scan in | Scan Out | Gap |
|---|---|---|---|---|
1 | 56 | 11:00:00 | 11:09:00 | 9 |
| 1 | 55 | 11:30:00 | 11:46:00 | 16 |
| 2 | 45 | 11:35:00 | 11:40:00 | 5 |
| 2 | 75 | 11:46:00 | 11:50:00 | 4 |
| 3 | 89 | 11:56:00 | 11:57:00 | 1 |
| 3 | 78 | 11:58:00 | 12:00:00 | 2 |
Naturally, the correct data would be:
Warehouse# Sum of Gaps
1 25
2 9
3 3
However I am getting exactly four times the expected values. Does anyone know why this occurs and how to fix the issue?
Thanks and I appreciate any reply greatly.
Accepted Solutions
- Mark as New
- Bookmark
- Subscribe
- Mute
- Subscribe to RSS Feed
- Permalink
- Report Inappropriate Content
Hi Kevin,
I think we'd need to see your data model to determine exactly what the issue is, but it sounds like there's some duplication in your data. Maybe you have duplicate employee or warehouse records. If these are being used in your chart then that could account for incorrect results.
If you're not able to share your data model, I'd suggest making your dimension loads LOAD DISTINCT.
Marcus
- Mark as New
- Bookmark
- Subscribe
- Mute
- Subscribe to RSS Feed
- Permalink
- Report Inappropriate Content
Hi Marcus,
Thanks for the reply, appreciate it!
The LOAD DISTINCT works! However this prompts me to wonder why there are duplicates in the data as when I create a Table Box, I don't see any duplicates. I remember reading somewhere on the forum and also seeing first-hand that the table box excludes duplicated rows - is this true?
If it is true, what is the best way of seeing what the loaded data actually looks like? As I've been using Table Box to have visibility of the data tables.
Thanks,
Kevin
- Mark as New
- Bookmark
- Subscribe
- Mute
- Subscribe to RSS Feed
- Permalink
- Report Inappropriate Content
Yes, table box only shows the distinct combination of fields you added to your table box object. To view everything, I usually add all rows to a straight table and add 1 or Count(FieldName) as the expression. This won't remove duplicates.
HTH
Best,
Sunny
- Mark as New
- Bookmark
- Subscribe
- Mute
- Subscribe to RSS Feed
- Permalink
- Report Inappropriate Content
Hi Sunny,
When you say add all rows, do you mean add all fields as a dimension? Could you clarify more on what you mean by "Add 1"?
The Count method works fine but it only shows how many duplicates there are, right? It doesn't actually output the duplicates as another row.
Thanks,
Kev
- Mark as New
- Bookmark
- Subscribe
- Mute
- Subscribe to RSS Feed
- Permalink
- Report Inappropriate Content
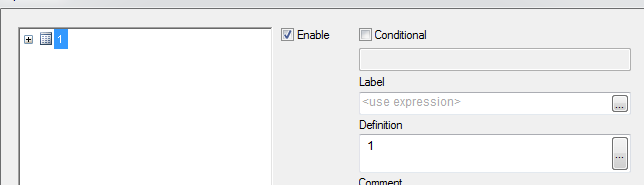
When you say add all rows, do you mean add all fields as a dimension? Could you clarify more on what you mean by "Add 1"?
Your expression needs to say 1
- Mark as New
- Bookmark
- Subscribe
- Mute
- Subscribe to RSS Feed
- Permalink
- Report Inappropriate Content
awesome, thanks very much!
Thank you Marcus.Malinow as well for helping me with my previous query 
- Mark as New
- Bookmark
- Subscribe
- Mute
- Subscribe to RSS Feed
- Permalink
- Report Inappropriate Content
No problem bud.
I am glad I was able to help.
Best,
Sunny
- Mark as New
- Bookmark
- Subscribe
- Mute
- Subscribe to RSS Feed
- Permalink
- Report Inappropriate Content
try this..
Select Dimension as Warehouse and in expression give :=Aggr(Sum(Gap),Warehouse)