Unlock a world of possibilities! Login now and discover the exclusive benefits awaiting you.
- Qlik Community
- :
- All Forums
- :
- QlikView App Dev
- :
- Re: Sum of average value in Pivot chart
- Subscribe to RSS Feed
- Mark Topic as New
- Mark Topic as Read
- Float this Topic for Current User
- Bookmark
- Subscribe
- Mute
- Printer Friendly Page
- Mark as New
- Bookmark
- Subscribe
- Mute
- Subscribe to RSS Feed
- Permalink
- Report Inappropriate Content
Sum of average value in Pivot chart
Hi All,
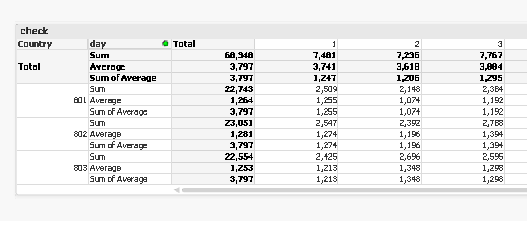
In pivot table I need to find the total sum of average for all tables. But I got wrong value for total sum of average for each day.
Please see the attachment. Can anyone help me on this.
Thank you in advance.
Kind Regards,
Tamil
- « Previous Replies
- Next Replies »
- Mark as New
- Bookmark
- Subscribe
- Mute
- Subscribe to RSS Feed
- Permalink
- Report Inappropriate Content
Mario: I guess we are close. But it taking average value for country code 801 and missed to take another countries (taking average for first row). I guess we need modify this statement by adding no of rows. I tried but its not working for me. Can you check?
top(Sum(Aggr(Avg(Sales), Country, day)))

- Mark as New
- Bookmark
- Subscribe
- Mute
- Subscribe to RSS Feed
- Permalink
- Report Inappropriate Content
This is what I get with the expression: IF (Dimensionality()=0, RangeSum(top(avg( Sales),1,NoOfRows()))) in the Sum Average and IF (Dimensionality()=0, IF (Dimensionality()=0, RangeSum(top(avg( Sales),1,NoOfRows()))) ,Avg(Sales))
in the Average.
- Mark as New
- Bookmark
- Subscribe
- Mute
- Subscribe to RSS Feed
- Permalink
- Report Inappropriate Content
First of all, Thank you so much for taking your time to resolve this. I guess the row names confused you. Sorry for that. Everything is fine except one thing. See below screenshot.
**Finally I found the solution by modifying Mario's expression:
IF (Dimensionality()=0, IF (ColumnNo()=0, RangeSum(top(avg(Sales),1,NoOfRows())),Rangeavg(top(Avg(Sales),1,NoOfRows()))), Avg(Sales))
Jagan and Mario: Thanks a lot guys. ![]() Have a nice day.
Have a nice day.
- Mark as New
- Bookmark
- Subscribe
- Mute
- Subscribe to RSS Feed
- Permalink
- Report Inappropriate Content
Solution: 🙂
IF (ColumnNo()=0, RangeSum(top(avg( Sales),1,NoOfRows())),
IF (Dimensionality()=0,
RangeAvg(top(avg(Sales),1,NoOfRows())) ,
avg(Sales)
))

- « Previous Replies
- Next Replies »