Unlock a world of possibilities! Login now and discover the exclusive benefits awaiting you.
- Qlik Community
- :
- All Forums
- :
- QlikView App Dev
- :
- Sum of rows in pivot table
- Subscribe to RSS Feed
- Mark Topic as New
- Mark Topic as Read
- Float this Topic for Current User
- Bookmark
- Subscribe
- Mute
- Printer Friendly Page
- Mark as New
- Bookmark
- Subscribe
- Mute
- Subscribe to RSS Feed
- Permalink
- Report Inappropriate Content
Sum of rows in pivot table
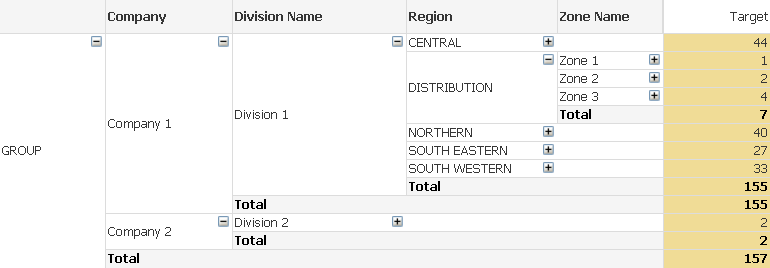
I've searched in this forum and haven't found my exact issue raised, wondering if this is possible: I have a pivot table which can be expanded at various nodes by the user and a Target column which is calculated based on existing data (does some rounding). They decide what level each Target needs to be calculated at, by expanding or collapsing dimensions. But I need the total rows to show the total of the lower level rows, not recalculate with rounding, as currently totals do not add up.
In the chart below, the total for Company 1 (and Division 1) should be 151, not 155. I played around with dimensionality() and aggr() but the formula will be different depending on what nodes have been expanded. Anyone know how I can do this?
- Mark as New
- Bookmark
- Subscribe
- Mute
- Subscribe to RSS Feed
- Permalink
- Report Inappropriate Content
The problem is that the expand/collapse state is not exposed to the expression in any way and expanding or collapsing does not affect the execution of the expression, which leaves only Sunny's suggestion as at least a partial solution.
Here's an out of the box suggestion:
- Create the pivot table with all the dimensions and set to always fully expanded.
- Create a variable (lets call it vLevel).
- Add a text box with a + and another with a - sign. The actions would be to increase or decrease vLevel in a limited range.
- Set enable conditional for all the collapsible fields and base the display on the variable:
- =If(vLevel >= 1, 1, 0) for the highest level collapsible
- =If(vLevel >= 2, 1, 0) for the next
- and so on.
- Now you can use vLevel if the expression needs to respond to the level.
- Another variable (lets call it vAggDims) with the expression (including the leading zero):
=Pick(vLevel, '.... aggr fields for 1 ...', '.... aggr fields for 2 ...', .....)
- Now you can just inject vAggDims into the main chart expression to have the aggr respond to the level.
=Sum(Aggr(..... your expression ...., $(vAggDims)))
I have not tested this, but I think it will work...
- Mark as New
- Bookmark
- Subscribe
- Mute
- Subscribe to RSS Feed
- Permalink
- Report Inappropriate Content
Hmm, but each row would need it's own vLevel value? The aggr() formula needs to be different depending on what has been expanded for that row. So I couldn't just have one expression. Unless I'm misunderstanding?
- Mark as New
- Bookmark
- Subscribe
- Mute
- Subscribe to RSS Feed
- Permalink
- Report Inappropriate Content
This might be totally not what you want, but it appears that you will ultimately be exporting the data into an Excel file where you would want to see the totals. If the above statement is right, can you may be use a Macro to export the chart, doing this you can program your Macro to correctly sum the rows above it. Not saying it would be straight forward, but an option nonetheless.
- Mark as New
- Bookmark
- Subscribe
- Mute
- Subscribe to RSS Feed
- Permalink
- Report Inappropriate Content
Yes I think that might be my only option, unless I get the user to add the totals in later. This is an 'admin' type function and the user is quite familiar with Excel. But I had hoped I could show them the totals on the screen before they export. From their perspective (and mine to be honest) it is quite a simple request.
- Mark as New
- Bookmark
- Subscribe
- Mute
- Subscribe to RSS Feed
- Permalink
- Report Inappropriate Content
Simple yes, but sometimes we are at the mercy of the tool we are using. Also, seek advice from hic, marcowedel, tresesco
- Mark as New
- Bookmark
- Subscribe
- Mute
- Subscribe to RSS Feed
- Permalink
- Report Inappropriate Content
>>Hmm, but each row would need it's own vLevel value
OK, I was thinking just of expanding and collapsing. This approach would either expand or collapse all rows and should produce exactly the calculation that you need if I have understood this thread correctly. But if that is totally out of the question, then this approach won't work for you.
Anyway, use it... don't use it - it was just a thought.
- Mark as New
- Bookmark
- Subscribe
- Mute
- Subscribe to RSS Feed
- Permalink
- Report Inappropriate Content
No, they need to expand/collapse different levels. Thanks anyway!
- Mark as New
- Bookmark
- Subscribe
- Mute
- Subscribe to RSS Feed
- Permalink
- Report Inappropriate Content
Thanks. I'm just going to export detail, the user will do calcs in Excel.... gotta move on. But thank you so much for trying :-).
- Mark as New
- Bookmark
- Subscribe
- Mute
- Subscribe to RSS Feed
- Permalink
- Report Inappropriate Content
You might need to look into solutions for planning then.
One (not very user friendly) solution is attached.
Since the chart expression won't capture the collapsing / expanding actions, you need to tell QV the chart line target level in a different way. For example, you can use an input field to set the target level:
![2018-05-03 19_38_55-QlikView x64 - [E__Users_Stefan_Downloads_Pivot Table Totals (1).qvw_].png](/legacyfs/online/201420_2018-05-03 19_38_55-QlikView x64 - [E__Users_Stefan_Downloads_Pivot Table Totals (1).qvw_].png)
![2018-05-03 19_43_14-QlikView x64 - [E__Users_Stefan_Downloads_Pivot Table Totals_299574.qvw_].png](/legacyfs/online/201421_2018-05-03 19_43_14-QlikView x64 - [E__Users_Stefan_Downloads_Pivot Table Totals_299574.qvw_].png)
Again, not very user friendly, but all is done in QV.
You probably don't need the target level on raw data line granularity, but probably at least at the second most granular level.
- Mark as New
- Bookmark
- Subscribe
- Mute
- Subscribe to RSS Feed
- Permalink
- Report Inappropriate Content
Thank you. There are thousands at that level. I'm not sure the use would be ok with that many input variables? Would be a good solution for a smaller subset for sure.