Unlock a world of possibilities! Login now and discover the exclusive benefits awaiting you.
- Qlik Community
- :
- All Forums
- :
- QlikView App Dev
- :
- Sum values of each segment in bar chart
- Subscribe to RSS Feed
- Mark Topic as New
- Mark Topic as Read
- Float this Topic for Current User
- Bookmark
- Subscribe
- Mute
- Printer Friendly Page
- Mark as New
- Bookmark
- Subscribe
- Mute
- Subscribe to RSS Feed
- Permalink
- Report Inappropriate Content
Sum values of each segment in bar chart
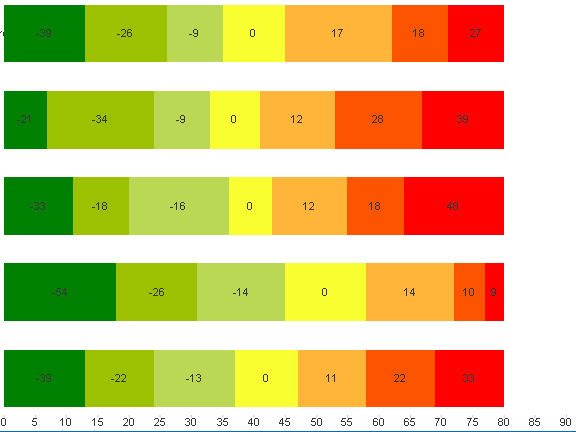
Attached is a chart where values (Count of segment * Score for that segment) are displayed within each segment of the chart. However, is there a way to get the total of all segment values at the end of the bar?
Thanks in advance.
- Mark as New
- Bookmark
- Subscribe
- Mute
- Subscribe to RSS Feed
- Permalink
- Report Inappropriate Content
Yes, kindly upload your sample file..
- Mark as New
- Bookmark
- Subscribe
- Mute
- Subscribe to RSS Feed
- Permalink
- Report Inappropriate Content
I only have QlikView PE.
The bar size is determined by:
Count({$<[Question Number] = {'5'}>} DISTINCT [Respondent ID])
The data values are determined by:
SUM({$<[Question Number] = {'5'}>} [Answer Value]) * Count({$<[Question Number] = {'5'}>} DISTINCT [Respondent ID])
- Mark as New
- Bookmark
- Subscribe
- Mute
- Subscribe to RSS Feed
- Permalink
- Report Inappropriate Content
I need data also. Without I can't work on your file...
even though you have PE, once will found solution, will give your expressions.
- Mark as New
- Bookmark
- Subscribe
- Mute
- Subscribe to RSS Feed
- Permalink
- Report Inappropriate Content
You can achive this by creating a second expression which creates the total. Follow the below steps.
1. Create a second expression using AGGR function. If you have 2 dimension in yor graph year and month then the expression would read as 'aggr(sum(Actuals),Month)
2. Enable the 'Value of data point' property for this expression.
Hope these steps help?
- Mark as New
- Bookmark
- Subscribe
- Mute
- Subscribe to RSS Feed
- Permalink
- Report Inappropriate Content
Not effective, the AGGR function does not seem to be helpful in this case
- Mark as New
- Bookmark
- Subscribe
- Mute
- Subscribe to RSS Feed
- Permalink
- Report Inappropriate Content
It is working for the sample dashboard that I have created.
I should be able to help if you post your sample QVW,...
- Mark as New
- Bookmark
- Subscribe
- Mute
- Subscribe to RSS Feed
- Permalink
- Report Inappropriate Content
Sample File. Muralidhar Koti, Manish Kachhia
- Mark as New
- Bookmark
- Subscribe
- Mute
- Subscribe to RSS Feed
- Permalink
- Report Inappropriate Content
SUM({$<[Question Number] = {'7'}>} total <[Question Text]> [Answer Value])
Bolded is the crucial part of this calculation that allows for the calculation of the total of all segments.