Unlock a world of possibilities! Login now and discover the exclusive benefits awaiting you.
- Qlik Community
- :
- All Forums
- :
- QlikView App Dev
- :
- Re: Supress zero value expressions
- Subscribe to RSS Feed
- Mark Topic as New
- Mark Topic as Read
- Float this Topic for Current User
- Bookmark
- Subscribe
- Mute
- Printer Friendly Page
- Mark as New
- Bookmark
- Subscribe
- Mute
- Subscribe to RSS Feed
- Permalink
- Report Inappropriate Content
Supress zero value expressions
I have a problem with presenting a clustered chart. I have several variables (expressions) (A, B, C, etc) that have values i.e. in 2012, some of these A, B and C have values in previous years. When no data is present in any of these previous years, the letter (A,B, C) is
stilldisplayed. How can I turn this off? A in 2012 is the same A as in 2011, 2010, etc. The same is applicable for B, C, etc.
Expression:
(sum(Variable1) + sum(Variable2))
/
sum([Variable3])

- « Previous Replies
-
- 1
- 2
- Next Replies »
- Mark as New
- Bookmark
- Subscribe
- Mute
- Subscribe to RSS Feed
- Permalink
- Report Inappropriate Content
the answer is yes
because you use more then one dimension
then you see all the values in each dimension that have at least one time where they have value that is bigger then 0
- Mark as New
- Bookmark
- Subscribe
- Mute
- Subscribe to RSS Feed
- Permalink
- Report Inappropriate Content
Okay, but my data model looks like this (se screenshot; don't know how to upload a file). Where E, F, I and J do have data in 2012 for the three different variables, but for the same variables in 2011, no data is present at all. Yet these four IDs are shown in 2011. 'Supress when null value' isn't working. 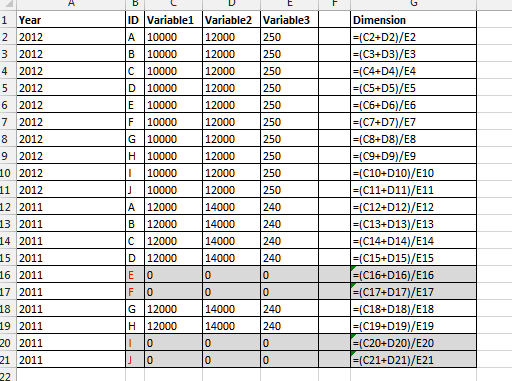
- Mark as New
- Bookmark
- Subscribe
- Mute
- Subscribe to RSS Feed
- Permalink
- Report Inappropriate Content
Liron Bra'am: if you see the example below. In some cases, each dimension has a value of zero. A solution is hopefully possible. I use data of many years, which can show thereby many gaps between the barcharts. For readability not desirable.
- « Previous Replies
-
- 1
- 2
- Next Replies »