Unlock a world of possibilities! Login now and discover the exclusive benefits awaiting you.
- Qlik Community
- :
- All Forums
- :
- QlikView App Dev
- :
- Switching charts between absolute and relative
Options
- Subscribe to RSS Feed
- Mark Topic as New
- Mark Topic as Read
- Float this Topic for Current User
- Bookmark
- Subscribe
- Mute
- Printer Friendly Page
Turn on suggestions
Auto-suggest helps you quickly narrow down your search results by suggesting possible matches as you type.
Showing results for
Anonymous
Not applicable
2016-07-04
01:36 PM
- Mark as New
- Bookmark
- Subscribe
- Mute
- Subscribe to RSS Feed
- Permalink
- Report Inappropriate Content
Switching charts between absolute and relative
Hi Guys,
I was asked to create a chart that allows me to switch their values between relative and absolute Today I can only do this (It's a stacked chart) look:
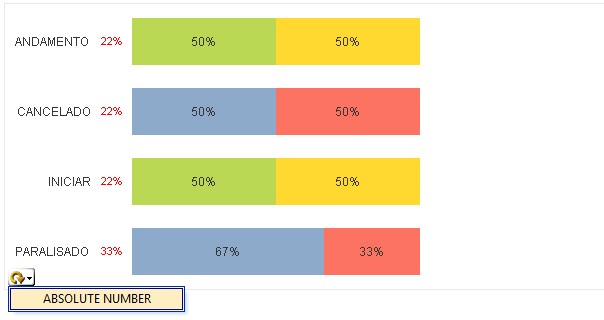
When I click on the ABSOLUTE NUMBER, the graph changes the values in the left., see:

I want not only change the values on Axis (in red), but change ALL the values on data points too. I grouped ABSOLUTE NUMBER and RELATIVE NUMBER to be able to change their values, but when I try to group the other graphics, nothing works.
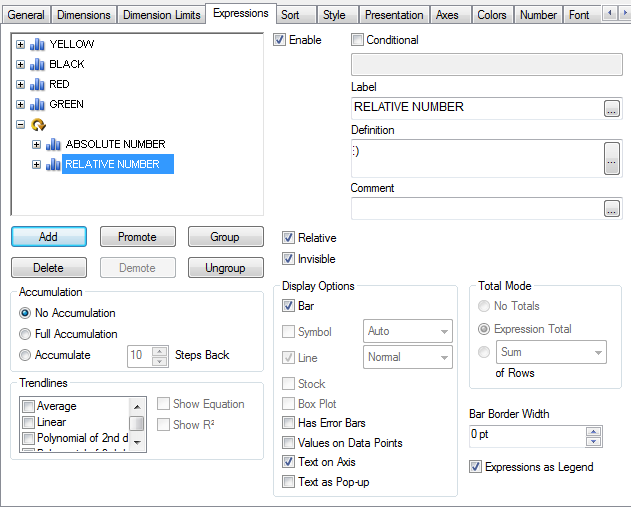
Thats my expression organization:
Thank you, guys.
628 Views
0 Replies