Unlock a world of possibilities! Login now and discover the exclusive benefits awaiting you.
- Qlik Community
- :
- All Forums
- :
- QlikView App Dev
- :
- Re: Synchronize block height in block chart
- Subscribe to RSS Feed
- Mark Topic as New
- Mark Topic as Read
- Float this Topic for Current User
- Bookmark
- Subscribe
- Mute
- Printer Friendly Page
- Mark as New
- Bookmark
- Subscribe
- Mute
- Subscribe to RSS Feed
- Permalink
- Report Inappropriate Content
Synchronize block height in block chart
Is it possible to "straighten" a certain formula in a block chart to 100% to visualize the percentage between two formulas?
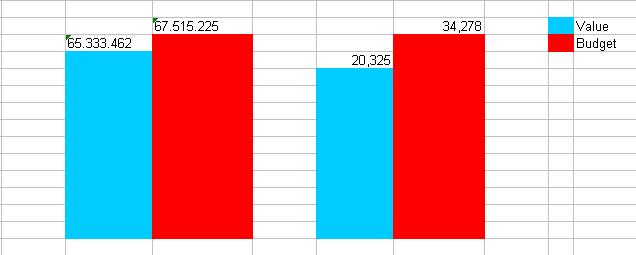
See attaced pictures - number 1 ist what I realized in QV so far, and number 2 is what I need.
The formulas are simply two sum()-formulas - budget should always be 100 %.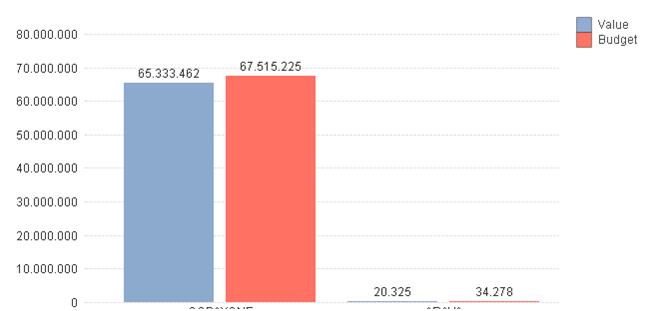
Thanks in advance!
- Mark as New
- Bookmark
- Subscribe
- Mute
- Subscribe to RSS Feed
- Permalink
- Report Inappropriate Content
Eva,
I would use a percentage scale for my bar chart then.
Try to set 100% to your budget for each dimension value. If you absolutely need to display also total values, you could create a second expression, and remove the bar tick from the display options, select Value on data points instead.
Please see attached.
The exact syntax for the expression is depending on your data model, if you post some more information on that or a best a small sample app, I could help with that too.
Regards,
Stefan
- Mark as New
- Bookmark
- Subscribe
- Mute
- Subscribe to RSS Feed
- Permalink
- Report Inappropriate Content
Hi Eva,
maybe not exactly what you need but hopefully useful.
For me the visual effect isn't correct, to see two different Budget values with the same bar height.
best regards
Mario
- Mark as New
- Bookmark
- Subscribe
- Mute
- Subscribe to RSS Feed
- Permalink
- Report Inappropriate Content
Hi Mario,
thanks for your reply - indeed, this is almost exactly what we need. I tried it before as bar chart, but this did not work 😉
Do you see any chance to get the total values displayed on the value bars? I played around with it, but couldnt get it to work.
You are right, that the visual effect could be confusing. But this layout is what the customers wants, because they are used to it.
Regards,
Eva
- Mark as New
- Bookmark
- Subscribe
- Mute
- Subscribe to RSS Feed
- Permalink
- Report Inappropriate Content
Eva_Stein schrieb:
... I played around with it, but couldnt get it to work.
Hi Eva,
me too!
I expect more isn't possible!
regards
Mario