Unlock a world of possibilities! Login now and discover the exclusive benefits awaiting you.
- Qlik Community
- :
- All Forums
- :
- QlikView App Dev
- :
- Re: Table box hide column and show selected value
- Subscribe to RSS Feed
- Mark Topic as New
- Mark Topic as Read
- Float this Topic for Current User
- Bookmark
- Subscribe
- Mute
- Printer Friendly Page
- Mark as New
- Bookmark
- Subscribe
- Mute
- Subscribe to RSS Feed
- Permalink
- Report Inappropriate Content
Table box hide column and show selected value
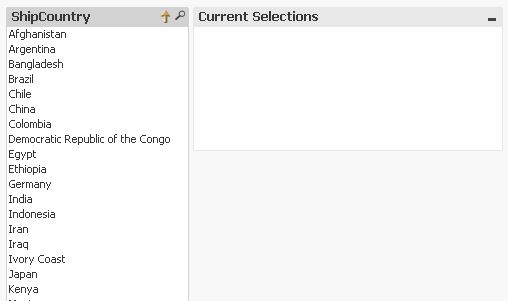
I have a tablebox with two columns "ShipCity","ShipCountry" (as per attached scree shot)
I want the data should be displayed based on filter for eg ShipCountry="France" and also the want to hide "ShipCountry" column.
Accepted Solutions
- Mark as New
- Bookmark
- Subscribe
- Mute
- Subscribe to RSS Feed
- Permalink
- Report Inappropriate Content
Use a straight table chart instead of a table box.
Use two dimensions, ShipCity and ShipCountry
Use one expression
=sum({<ShipCountry = {'France'}>} 1)
On presentation tab of chart properties, check that 'suppress zero values' option is enabled and hide columns for dimension ShipCountry and the single expression.
- Mark as New
- Bookmark
- Subscribe
- Mute
- Subscribe to RSS Feed
- Permalink
- Report Inappropriate Content
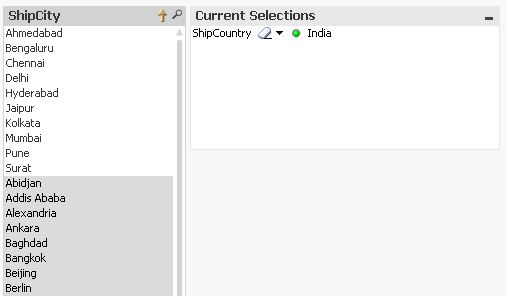
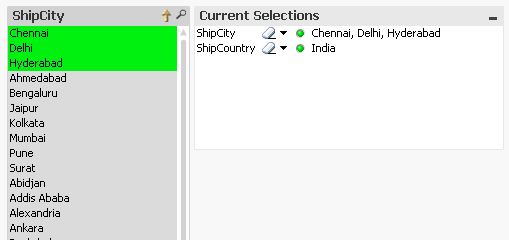
You could create a drill down dimension group consisting of your fields "ShipCity" and "ShipCountry" and use this in a ListBox.
regards
Marco
- Mark as New
- Bookmark
- Subscribe
- Mute
- Subscribe to RSS Feed
- Permalink
- Report Inappropriate Content
maybe like this:
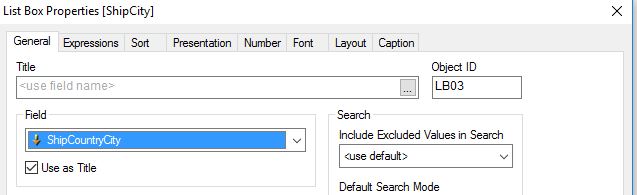
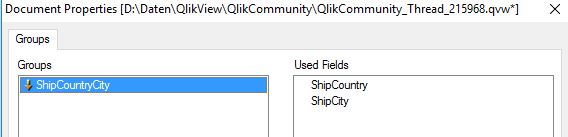
regards
Marco