Unlock a world of possibilities! Login now and discover the exclusive benefits awaiting you.
Announcements
FLASH SALE: Save $500! Use code FLASH2026 at checkout until Feb 14th at 11:59PM ET. Register Now!
- Qlik Community
- :
- All Forums
- :
- QlikView App Dev
- :
- Re: Table column alignment
Options
- Subscribe to RSS Feed
- Mark Topic as New
- Mark Topic as Read
- Float this Topic for Current User
- Bookmark
- Subscribe
- Mute
- Printer Friendly Page
Turn on suggestions
Auto-suggest helps you quickly narrow down your search results by suggesting possible matches as you type.
Showing results for
Partner - Creator
2015-04-10
09:50 AM
- Mark as New
- Bookmark
- Subscribe
- Mute
- Subscribe to RSS Feed
- Permalink
- Report Inappropriate Content
Table column alignment
Hello i need a table with the data displayed in this form (Months in column, year with values and percentages):
| 1 | 2 | 3 | 4 | 5 | 6 | 7 | 8 | 9 | 10 | 11 | 12 | |
|---|---|---|---|---|---|---|---|---|---|---|---|---|
| 2014 | v | v | v | v | v | v | v | v | v | v | v | v |
| 2015 | w | w | w | w | w | w | w | w | w | w | w | w |
| Delta % | y | y | y | y | y | y | y | y | y | y | y | y |
I have noticed that with simple not pivot table the datas are displayed in column.
What have i to do to obtain a this result?
Thanks
Marco
412 Views
2 Replies
Creator III
2015-04-10
09:54 AM
- Mark as New
- Bookmark
- Subscribe
- Mute
- Subscribe to RSS Feed
- Permalink
- Report Inappropriate Content
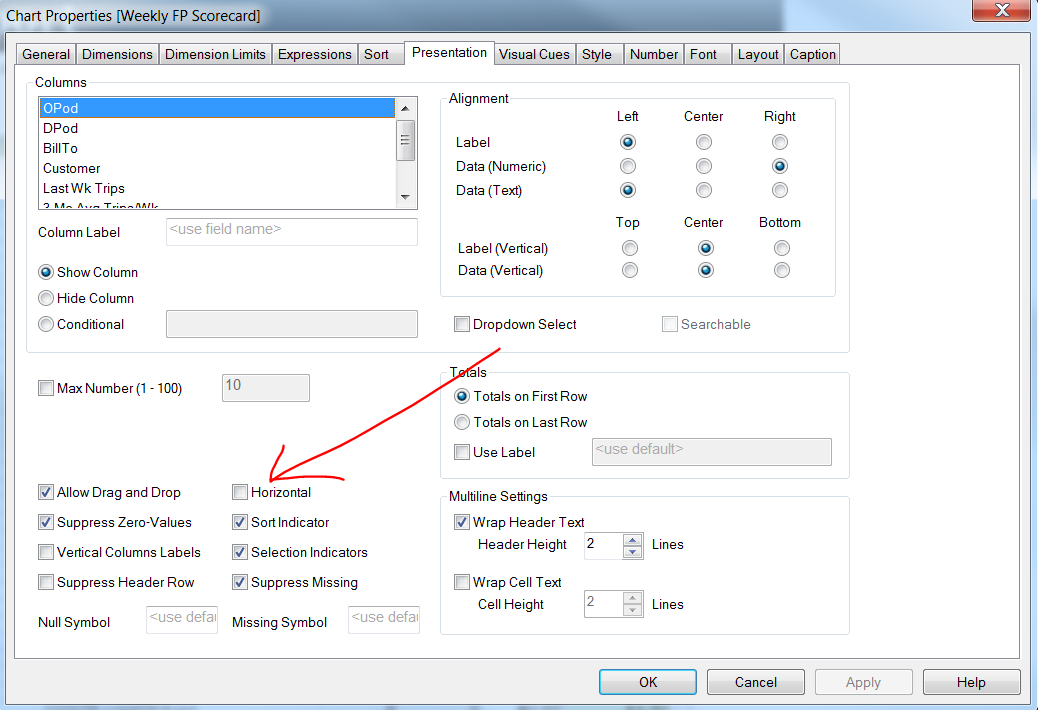
Try making your years and delta as expressions, with month as a dimension. Then, on the presentation tab of the properties, check 'Horizontal'
Mike
362 Views
Partner - Creator
2015-04-10
10:56 AM
Author
- Mark as New
- Bookmark
- Subscribe
- Mute
- Subscribe to RSS Feed
- Permalink
- Report Inappropriate Content
Is it possible to obtain this by using the year filed in the dimension section and use the sum field to obtain the result i expect?
Thanks
Marco
362 Views