Unlock a world of possibilities! Login now and discover the exclusive benefits awaiting you.
- Qlik Community
- :
- All Forums
- :
- QlikView App Dev
- :
- Table design
- Subscribe to RSS Feed
- Mark Topic as New
- Mark Topic as Read
- Float this Topic for Current User
- Bookmark
- Subscribe
- Mute
- Printer Friendly Page
- Mark as New
- Bookmark
- Subscribe
- Mute
- Subscribe to RSS Feed
- Permalink
- Report Inappropriate Content
Table design
Hello,
I have the following table two different ways, but the user is looking for something different. Here are the tables:
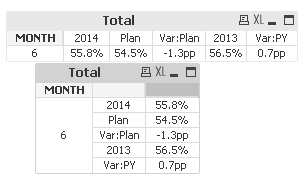
The user would like the 1st table to be augmented as follows:
Month 2014 Plan 2013
6 55.8 54.5 56.5
Variation -1.3pp .7pp
Can this be done? I have not found a way to drag the field as such, and could not find the correct syntax to create a calculated field.
Thanks in advance for the help!
- Tags:
- new_to_qlikview
- table
Accepted Solutions
- Mark as New
- Bookmark
- Subscribe
- Mute
- Subscribe to RSS Feed
- Permalink
- Report Inappropriate Content
As an alternative i think you could turn on a TOTALs rows and use if() logic in the expression with Dimensionality() to conditionally calculate the totals differently. Then its in 1 chart.
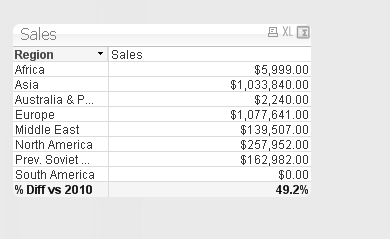
if ( Dimensionality()=0,
num( sum( {$<Year={2011}>} Sales) / sum(Sales),'#,##0.0%')
,
num(sum(Sales),'$#,##0.00;($#,##0.00)')
)
- Mark as New
- Bookmark
- Subscribe
- Mute
- Subscribe to RSS Feed
- Permalink
- Report Inappropriate Content
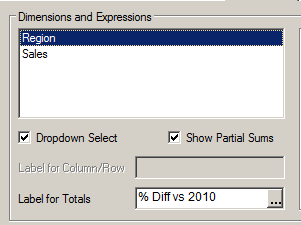
Yes this is possible, but you need to have 2 tables, one of them is the first without two columns for Var.
And the second table you need to put the values with formulas
- Mark as New
- Bookmark
- Subscribe
- Mute
- Subscribe to RSS Feed
- Permalink
- Report Inappropriate Content
Enrique,
Thank you for the response, can you describe a little further or display. I am having trouble putting together your suggestion.
- Mark as New
- Bookmark
- Subscribe
- Mute
- Subscribe to RSS Feed
- Permalink
- Report Inappropriate Content
As an alternative i think you could turn on a TOTALs rows and use if() logic in the expression with Dimensionality() to conditionally calculate the totals differently. Then its in 1 chart.
if ( Dimensionality()=0,
num( sum( {$<Year={2011}>} Sales) / sum(Sales),'#,##0.0%')
,
num(sum(Sales),'$#,##0.00;($#,##0.00)')
)
- Mark as New
- Bookmark
- Subscribe
- Mute
- Subscribe to RSS Feed
- Permalink
- Report Inappropriate Content
Hi,
Using cross table you may achieve it.
Regards,
Chinna
- Mark as New
- Bookmark
- Subscribe
- Mute
- Subscribe to RSS Feed
- Permalink
- Report Inappropriate Content
Jonathan,
Thank you that worked like a charm. Bailed me out again. I didn't think to use the dimensionality function, nor am I really familiar with that function and proper ways to use. Thanks again!