Unlock a world of possibilities! Login now and discover the exclusive benefits awaiting you.
- Qlik Community
- :
- All Forums
- :
- QlikView App Dev
- :
- Re: Table of statistics in QV
- Subscribe to RSS Feed
- Mark Topic as New
- Mark Topic as Read
- Float this Topic for Current User
- Bookmark
- Subscribe
- Mute
- Printer Friendly Page
- Mark as New
- Bookmark
- Subscribe
- Mute
- Subscribe to RSS Feed
- Permalink
- Report Inappropriate Content
Table of statistics in QV
Hi,
I'm a new user to QV. Not sure how to solve the following issue, any experts can help?
I have a dataset in excel file as follows:
| A | B | C |
|---|---|---|
| 2 | -5 | |
| -1 | 0 | -3 |
| 6 | 4 |
I want to import this file in QV and generate the following statistical table as a result:
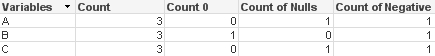
| Variables | Count | Count of Zeros | Count of Nulls | Count of negative values |
|---|---|---|---|---|
| A | 3 | 0 | 0 | 1 |
| B | 3 | 1 | 0 | 1 |
| C | 3 | 0 | 1 | 1 |
Anyone know how to do it? Thanks!
- « Previous Replies
-
- 1
- 2
- Next Replies »
- Mark as New
- Bookmark
- Subscribe
- Mute
- Subscribe to RSS Feed
- Permalink
- Report Inappropriate Content
Hi you can either achieve this by script or in the layout, Here is a solution in script :
Data:
CrossTable (Variables, Value)
LOAD null() AS Dummy, *; // Dummy field is required in order to be able to pivot the columns
LOAD * INLINE [
A, B, C
2, -5
-1, 0, -3
, 6, 4
];
Results:
LOAD Variables,
count(DISTINCT Value) AS Count,
sum(if(Value=0, 1, 0)) AS CountZeroes,
sum(if(isnull(Value), 1, 0)) AS CountNull,
sum(if(Value<0, 1, 0)) AS CountNegative
Resident Data
Group by Variables;
Hope it helps,
Michael
- Mark as New
- Bookmark
- Subscribe
- Mute
- Subscribe to RSS Feed
- Permalink
- Report Inappropriate Content
and here in the layout (chart)
see attachment
- Mark as New
- Bookmark
- Subscribe
- Mute
- Subscribe to RSS Feed
- Permalink
- Report Inappropriate Content
Thanks Michael! It really helps!
- Mark as New
- Bookmark
- Subscribe
- Mute
- Subscribe to RSS Feed
- Permalink
- Report Inappropriate Content
Thanks Massimo! I created the qvw file using your template, it works well.
Another thing I want to ask is, how to add a list box of a condition there? For example, what shall I do if I want to see how the counts change where A is not null.
Traditionally, I would add a list box and select variable A and make the restriction on it, but since you already created the cross table, I cannot select variable A anymore...I only three variables now: variables, value and dummy. Do you know how to solve this?
Many thanks!!!!!
- Mark as New
- Bookmark
- Subscribe
- Mute
- Subscribe to RSS Feed
- Permalink
- Report Inappropriate Content
Hi,
Easiest way to flag nulls is during the initial load; for example:
LOAD A, B, C, if(Len(A)=0, 'Yes', 'No') as [A is null]
FROM (Excel source)
;
I used Len()=0 to identify the empty cells; you also have Isnull() function, but Len()=0 also works on empty strings.
Then you can use [A is null] as filter, and check the change in your pivot chart.
Hope this helps
- Mark as New
- Bookmark
- Subscribe
- Mute
- Subscribe to RSS Feed
- Permalink
- Report Inappropriate Content
Hi Pierre, thanks for your suggestion! As Michael suggested, I used the following script to load the data, so it will create a cross table for me. However, if I do so, I will only return three variables: "Variables", "Value" and "Dummy", and I was not able to select any of my original variables such as A, B, C. Do you know where I should insert your "if(Len(A)=0, 'Yes', 'No') as [A is null]" into my existing script?
Thank you in advance!
My existing script:
Data:
CrossTable (Variables, Value)
LOAD null() AS Dummy, *; // Dummy field is required in order to be able to pivot the columns
LOAD * INLINE [
A, B, C
2, -5
-1, 0, -3
, 6, 4
];
- Mark as New
- Bookmark
- Subscribe
- Mute
- Subscribe to RSS Feed
- Permalink
- Report Inappropriate Content
OK. Then you need to add the flags before turning it into a crosstable.
Data:
CrossTable (Variables, Value)
LOAD null() AS Dummy, *; // Dummy field is required in order to be able to pivot the columns
LOAD *, if(Len(A)=0, 'Yes', 'No') as [A is null];
LOAD * INLINE [
A, B, C
2, -5
-1, 0, -3
, 6, 4
];
If you make Results table in script, you need to add new results in script too:
Results:
LOAD Variables,
count(DISTINCT Value) AS Count,
sum(if(Value=0, 1, 0)) AS CountZeroes,
sum(if(isnull(Value), 1, 0)) AS CountNull,
sum(if(Value<0, 1, 0)) AS CountNegative,
count(DISTINCT if([A is null]='No', Value)) AS CountANotNull,
sum(if(Value=0 and [A is null]='No', 1, 0)) AS CountZeroesANotNull,
sum(if(isnull(Value) and [A is null]='No', 1, 0)) AS CountNullANotNull,
sum(if(Value<0 and [A is null]='No', 1, 0)) AS CountNegativeANotNull
Resident Data
Group by Variables;
As you see, it's getting a bit heavy. Making Results in layout allows to use a simple filter, so it's more flexible at this point.
- Mark as New
- Bookmark
- Subscribe
- Mute
- Subscribe to RSS Feed
- Permalink
- Report Inappropriate Content
Hi Pierre, I tried your new script by adding this [A is null] before the load of A,B,C, but it doesn't work...My problem is that when creating a cross table, I'm not able to add a list box of the original variable A. My goal is to realize the dynamic changing of the cross table when my condition for A changes.
See the pics attached. After I create the cross table, I can only select "Dummy", "Variables", "Value" in <Field>.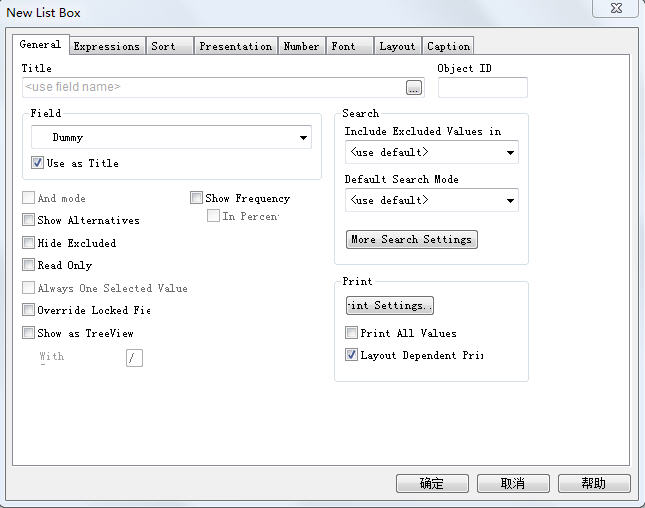
For the Result table, I prefer to do it in the layout instead of script. So don't worry about this part for now. Is it possible for you to attach me the .qvw file if you know how to solve the above problem?
Thanks a lot for your help and patience!
- Mark as New
- Bookmark
- Subscribe
- Mute
- Subscribe to RSS Feed
- Permalink
- Report Inappropriate Content
Hey Michael,
I had to modify the script to below in order to get the Variable Table to show the proper results for me.
//first set null interpreter to the string: NULL
SET NULLINTERPRET=;
Data:
CrossTable (Variables, Value)
LOAD null() AS Dummy,*; // Dummy field is required in order to be able to pivot the columns
LOAD * INLINE [
A, B, C
2, -5,
-1, 0, -3
, 6, 4
];
Results:
LOAD Variables,
count(DISTINCT Value) AS Count,
sum(if(Value=0, 1, 0)) AS CountZeroes,
//sum(if(isnull(Value), 1, 0)) AS CountNull,
sum(if(len(trim(Value))>0, 0, 1)) AS CountNull,
//sum(if(Value<0, 1, 0)) AS CountNegative
sum(if(Value<0 and len(trim(Value))>0, 1, 0)) AS CountNegative
Resident Data
Group by Variables;
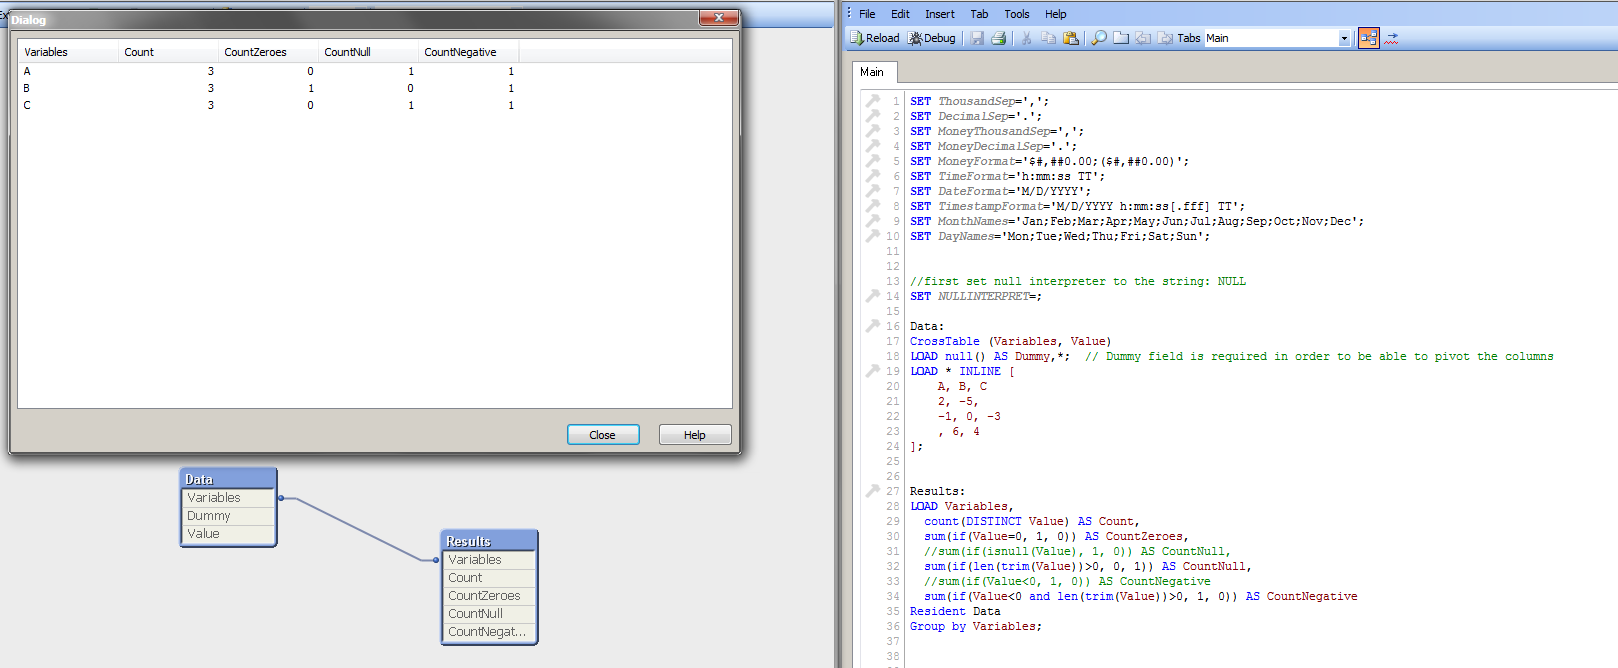
If i use the script the way you provided (snapshot below) I get the wrong results. I believe it is the way the Null values are being handled in the Inline Load. If someone could explain why in further detail I would much appreciate it.

- « Previous Replies
-
- 1
- 2
- Next Replies »