Unlock a world of possibilities! Login now and discover the exclusive benefits awaiting you.
- Qlik Community
- :
- All Forums
- :
- QlikView App Dev
- :
- Table pivot in Loading script
- Subscribe to RSS Feed
- Mark Topic as New
- Mark Topic as Read
- Float this Topic for Current User
- Bookmark
- Subscribe
- Mute
- Printer Friendly Page
- Mark as New
- Bookmark
- Subscribe
- Mute
- Subscribe to RSS Feed
- Permalink
- Report Inappropriate Content
Table pivot in Loading script
Hello All,
I am new on Qlikview so accept my apologizes if my question is too easy.
in a loading script I am loading a table like the one below:
| Project | Est Cost 2017 | Est Cost 2018 | Est Cost 2019 | Est Cost 2020 |
|---|---|---|---|---|
| Proj 1 | 100 | 50 | 80 | 80 |
| Proj 2 | 120 | 100 | 70 | 50 |
| Proj 3 | ... | ... | ||
| Proj 4 |
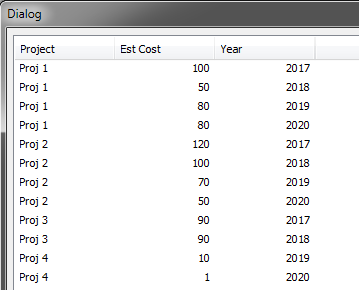
I would like to create in the script a table from the one above to look like the one below:
| Project | Est cost | Year |
|---|---|---|
| Proj1 | 100 | 2017 |
| Proj 1 | 50 | 2018 |
| Proj 1 | 80 | 2019 |
| Proj 1 | 80 | 2020 |
| Proj 2 | 120 | 2017 |
| Proj 2 | 100 | 2018 |
| Proj 2 | 70 | 2019 |
| Proj 2 | 50 | 2020 |
| ... |
Would you know how to do that?
Regards,
Pierre.
Accepted Solutions
- Mark as New
- Bookmark
- Subscribe
- Mute
- Subscribe to RSS Feed
- Permalink
- Report Inappropriate Content
Hi Pierre,
Take a look here. Cross table instruction will help you
- Mark as New
- Bookmark
- Subscribe
- Mute
- Subscribe to RSS Feed
- Permalink
- Report Inappropriate Content
- Mark as New
- Bookmark
- Subscribe
- Mute
- Subscribe to RSS Feed
- Permalink
- Report Inappropriate Content
Hi Pierre
tmp:
CrossTable(Year, [Est Cost])
LOAD * Inline
[
Project,Est Cost 2017,Est Cost 2018,Est Cost 2019,Est Cost 2020
Proj 1,100,50,80,80
Proj 2,120,100,70,50
Proj 3,90,90,,
Proj 4,,,10,1
];
NoConcatenate
SUMARY:
LOAD
Project,
[Est Cost],
Right(Year,4) as Year Resident tmp
Where [Est Cost]>0
;
DROP Table tmp;
- Mark as New
- Bookmark
- Subscribe
- Mute
- Subscribe to RSS Feed
- Permalink
- Report Inappropriate Content
Hi ,
You could also use Pivot chart directly and get this result.
Kindly find attached QV document in which i did same.
Thanks ,
Ankita
- Mark as New
- Bookmark
- Subscribe
- Mute
- Subscribe to RSS Feed
- Permalink
- Report Inappropriate Content
Thank you very much, it works great.
Regards,
Pierre.
- Mark as New
- Bookmark
- Subscribe
- Mute
- Subscribe to RSS Feed
- Permalink
- Report Inappropriate Content
Thank you very much for your help, this is ,perfect.
Regards,
Pierre.