Unlock a world of possibilities! Login now and discover the exclusive benefits awaiting you.
- Qlik Community
- :
- All Forums
- :
- QlikView App Dev
- :
- Re: Table without Dimensions
- Subscribe to RSS Feed
- Mark Topic as New
- Mark Topic as Read
- Float this Topic for Current User
- Bookmark
- Subscribe
- Mute
- Printer Friendly Page
- Mark as New
- Bookmark
- Subscribe
- Mute
- Subscribe to RSS Feed
- Permalink
- Report Inappropriate Content
Table without Dimensions
Table without Dimensions
Good afternoon there is some way to make a table without dimensions and without leaving a blank column.

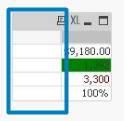
This object is a pivot table without dimensions only expressions but it puts an additional column in white which I had to give it some format but at this moment I do not need it, since I need to occupy this table for nprinting.
Can somebody help me?
- Mark as New
- Bookmark
- Subscribe
- Mute
- Subscribe to RSS Feed
- Permalink
- Report Inappropriate Content
Hi,
yes we can do that. simply use the pivot table and then try add all your measure (give one tab space instead of label name) that should return o/p like below
for the text/background color on you measure also u can apply
- Mark as New
- Bookmark
- Subscribe
- Mute
- Subscribe to RSS Feed
- Permalink
- Report Inappropriate Content
If you using only Expression to be visible. Why don't you use straight table and hide the dimension column from Presentation tab.
- Mark as New
- Bookmark
- Subscribe
- Mute
- Subscribe to RSS Feed
- Permalink
- Report Inappropriate Content
Good evening I have my object as you mention it but when using the object in nprinting the empty column requires a blank space

- Mark as New
- Bookmark
- Subscribe
- Mute
- Subscribe to RSS Feed
- Permalink
- Report Inappropriate Content
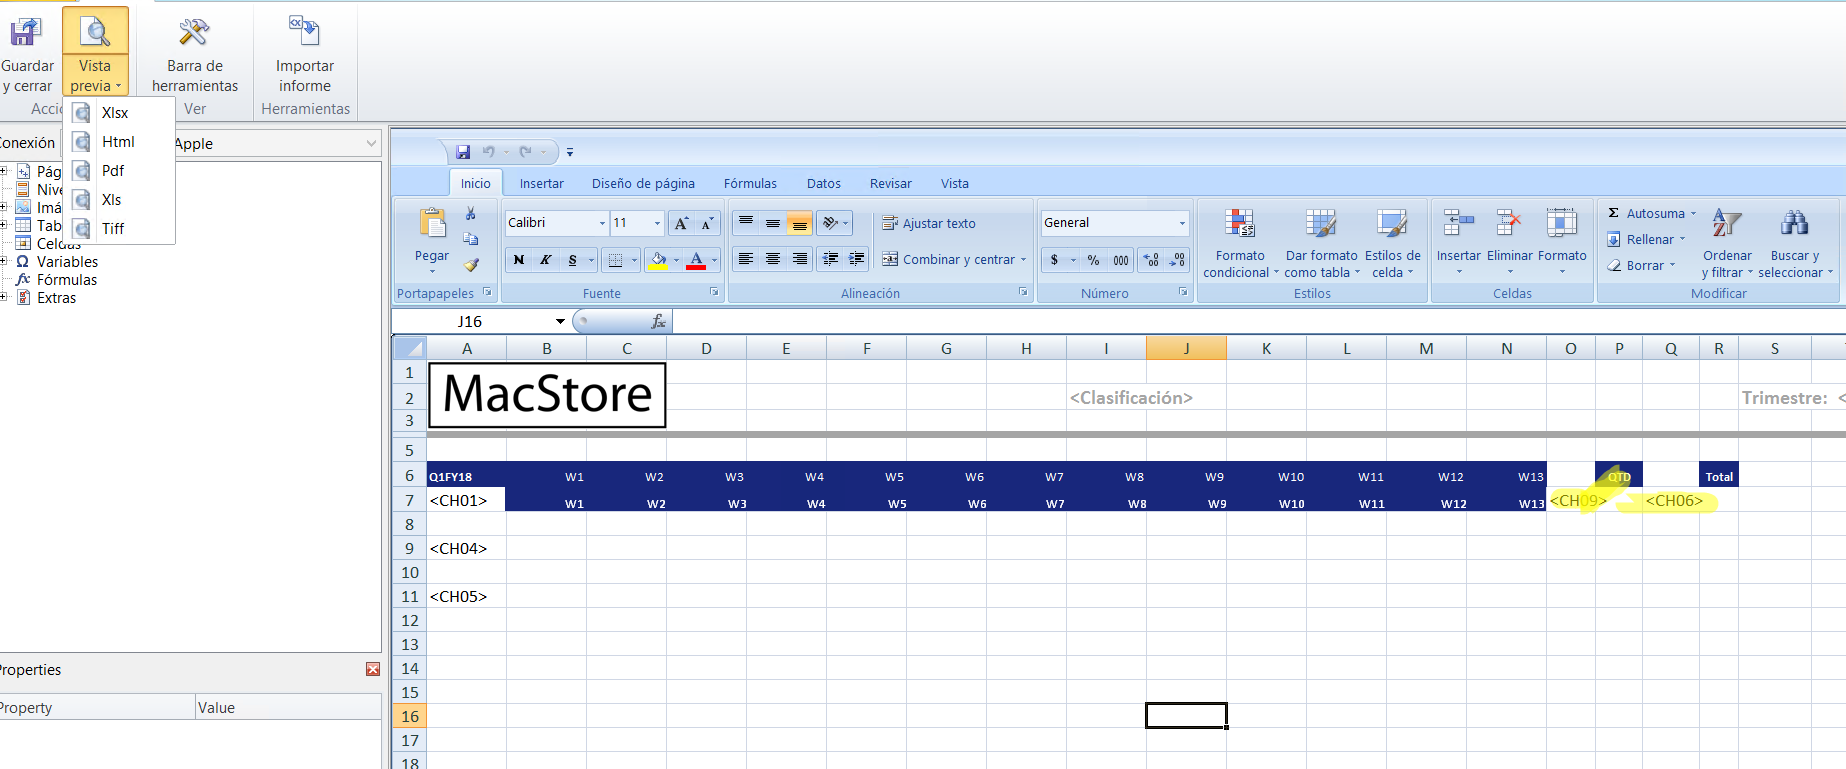
The reason why I do not occupy a simple table is because nprinting does not let me put the indicators vertically.
When I place the object in the preview, the horizontal table appears
- Mark as New
- Bookmark
- Subscribe
- Mute
- Subscribe to RSS Feed
- Permalink
- Report Inappropriate Content
Hi,
It should work in Nprinting as well. can u share your mock with expected output.
- Mark as New
- Bookmark
- Subscribe
- Mute
- Subscribe to RSS Feed
- Permalink
- Report Inappropriate Content
Hi, I'm using two pivot tables and I have to put them together but they will not let me put them together for the additional column.


- Mark as New
- Bookmark
- Subscribe
- Mute
- Subscribe to RSS Feed
- Permalink
- Report Inappropriate Content
At this time, separate them by a column, but if they do not show an object
- Mark as New
- Bookmark
- Subscribe
- Mute
- Subscribe to RSS Feed
- Permalink
- Report Inappropriate Content
Hi,
best way u can try add all the local calculated measure (using set analysis expression) into one chart (W1,W2, QTD & Total etc) then u can get the fine version of output.
Check this article for the Weekly,QTD expression sample
Thanks
Deva