Unlock a world of possibilities! Login now and discover the exclusive benefits awaiting you.
- Qlik Community
- :
- All Forums
- :
- QlikView App Dev
- :
- Table
- Subscribe to RSS Feed
- Mark Topic as New
- Mark Topic as Read
- Float this Topic for Current User
- Bookmark
- Subscribe
- Mute
- Printer Friendly Page
- Mark as New
- Bookmark
- Subscribe
- Mute
- Subscribe to RSS Feed
- Permalink
- Report Inappropriate Content
Table
Hi all
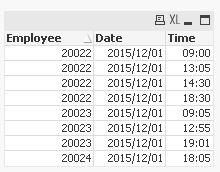
I have a table with the following info from a time clock machine
Employee, Date, Time
20022, 2015/12/01, 09:00
20022, 2015/12/01, 13:05
20022, 2015/12/01, 14:30
20022, 2015/12/01, 18:30
20023, 2015/12/01, 09:05
20023, 2015/12/01, 12:55
20023, 2015/12/01, 19:01
20024, 2015/12/01, 18:05
...
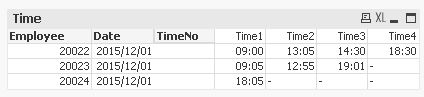
I need to show the table as
Employee Date Time1 Time2 Time3 Time4
20022 2015/12/01 09:00 13:05 14:30 18:30
20023 2015/12/01 09:05 12:55 19:01
20024 2015/12/01 18:05
The number of times the employee clocks in/out a day can change (as the example)
Any ideas?
Tried pivot table and nothing... cant show the clock in/out in a line
Thank you
Hugo
- Tags:
- new_to_qlikview
Accepted Solutions
- Mark as New
- Bookmark
- Subscribe
- Mute
- Subscribe to RSS Feed
- Permalink
- Report Inappropriate Content
Table:
Load
*
Inline [
Employee, Date, Time
20022, 2015/12/01, 09:00
20022, 2015/12/01, 13:05
20022, 2015/12/01, 14:30
20022, 2015/12/01, 18:30
20023, 2015/12/01, 09:05
20023, 2015/12/01, 12:55
20023, 2015/12/01, 19:01
20024, 2015/12/01, 18:05
];
NewTable:
Load
Employee,
Date,
Time,
rangesum( 1, if(peek('Employee') = Employee and peek('Date') = Date, peek(Clockout))) as Clockout
Resident
Table
order by Employee, Date, Time asc;
drop table Table;
Then in a pivot table add Employee, Date, and Clockout as Dimensions and only(Time) as expression:

- Mark as New
- Bookmark
- Subscribe
- Mute
- Subscribe to RSS Feed
- Permalink
- Report Inappropriate Content
Script:
Table:
LOAD *,
If(Previous(Employee) = Employee, RangeSum(Peek('SN'), 1), 1) as SN;
LOAD * Inline [
Employee, Date, Time
20022, 2015/12/01, 09:00
20022, 2015/12/01, 13:05
20022, 2015/12/01, 14:30
20022, 2015/12/01, 18:30
20023, 2015/12/01, 09:05
20023, 2015/12/01, 12:55
20023, 2015/12/01, 19:01
20024, 2015/12/01, 18:05
];

- Mark as New
- Bookmark
- Subscribe
- Mute
- Subscribe to RSS Feed
- Permalink
- Report Inappropriate Content
Table:
Load
*
Inline [
Employee, Date, Time
20022, 2015/12/01, 09:00
20022, 2015/12/01, 13:05
20022, 2015/12/01, 14:30
20022, 2015/12/01, 18:30
20023, 2015/12/01, 09:05
20023, 2015/12/01, 12:55
20023, 2015/12/01, 19:01
20024, 2015/12/01, 18:05
];
NewTable:
Load
Employee,
Date,
Time,
rangesum( 1, if(peek('Employee') = Employee and peek('Date') = Date, peek(Clockout))) as Clockout
Resident
Table
order by Employee, Date, Time asc;
drop table Table;
Then in a pivot table add Employee, Date, and Clockout as Dimensions and only(Time) as expression:
- Mark as New
- Bookmark
- Subscribe
- Mute
- Subscribe to RSS Feed
- Permalink
- Report Inappropriate Content
Hi,
a front end solution (without changing your data model) could be:
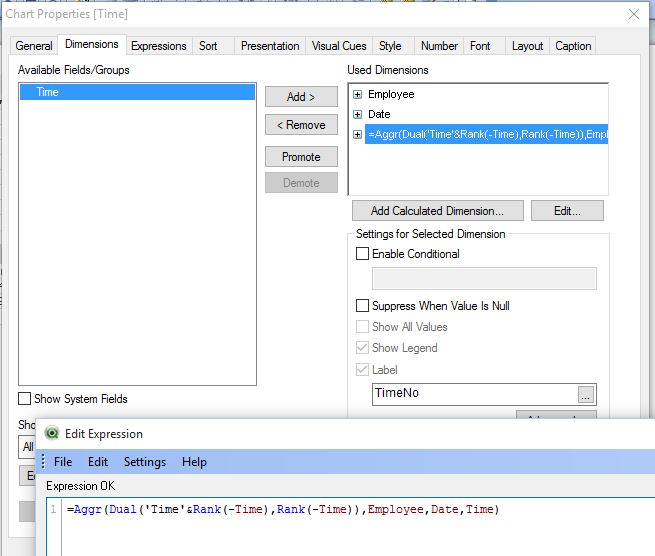
hope this helps
regards
Marco
- Mark as New
- Bookmark
- Subscribe
- Mute
- Subscribe to RSS Feed
- Permalink
- Report Inappropriate Content
another option to generate a time sequence field in the script:
table1:
LOAD *,
    AutoNumber(Time,Employee&'|'&Date) as TimeSeqNo
Inline [
    Employee, Date, Time
    20022, 2015/12/01, 09:00
    20022, 2015/12/01, 13:05
    20022, 2015/12/01, 14:30
    20022, 2015/12/01, 18:30
    20023, 2015/12/01, 09:05
    20023, 2015/12/01, 12:55
    20023, 2015/12/01, 19:01
    20024, 2015/12/01, 18:05
];
(given your table is sorted by time, otherwise a resident load might be necessary)
hope this helps
regards
Marco