Unlock a world of possibilities! Login now and discover the exclusive benefits awaiting you.
- Qlik Community
- :
- All Forums
- :
- QlikView
- :
- Text format of data point values in bar chart not ...
- Subscribe to RSS Feed
- Mark Topic as New
- Mark Topic as Read
- Float this Topic for Current User
- Bookmark
- Subscribe
- Mute
- Printer Friendly Page
- Mark as New
- Bookmark
- Subscribe
- Mute
- Subscribe to RSS Feed
- Permalink
- Report Inappropriate Content
Text format of data point values in bar chart not working
I have a tilted bar chart as Gantt graph. The bar is displayed by a formula with a dynamic background color, this works fine.
The second formula is to display specific text next to the bars as data point values.
My issue is that no matter how i try to change the formatting of this data point values, nothing changes.
I tried setting the background color, font color or the text format - it always sticks with the default format.
As i plan to change the text format to bold under specific conditions i cant do any global changes. I did make sure its the correct formula, removing the tick "Display Values in Graph" hides them and changing the formula expression does change the displayed value.
Any recommendation on why this maybe doesnt work is appreciated.
- Mark as New
- Bookmark
- Subscribe
- Mute
- Subscribe to RSS Feed
- Permalink
- Report Inappropriate Content
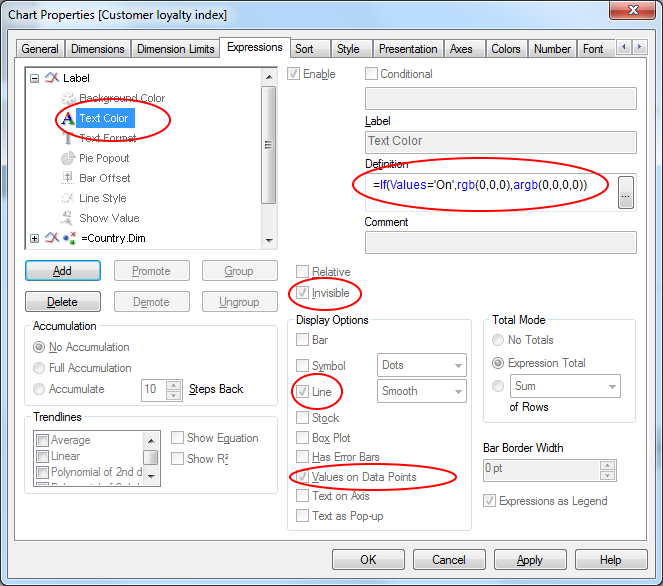
I once noticed that the the expression attributes did not function when the display line/bar property for this expression was not on. If so turn the display bar/line property on, but set it to invisible.
- Mark as New
- Bookmark
- Subscribe
- Mute
- Subscribe to RSS Feed
- Permalink
- Report Inappropriate Content
And a screenshot
- Mark as New
- Bookmark
- Subscribe
- Mute
- Subscribe to RSS Feed
- Permalink
- Report Inappropriate Content
This is a good idea and im sure this would work under differenct circumstances. However, there are some issues with it.
- I do have two formulas. WHile the first one (the bar itself with a value describing the length) works, the second one (label for the bars) doesnt in regard to text formatting.
- The second formula only contains the label description. While i can enable it being represented by a bar, it will fill the graph with invalid data.
- It is part of a Gantt chart which uses a bar offset on a date representation. If i turn on the bar it will change the offset to zero because of the invalid values, even if its set to invisible, ruining the whole graph.
I feel that this is a good direction anyways and will do some more attempts in this direction. If you have some more ideas id love to hear from it!
- Mark as New
- Bookmark
- Subscribe
- Mute
- Subscribe to RSS Feed
- Permalink
- Report Inappropriate Content
I'm not quite sure if I can envision what your exact situation is...
But, if I understand that your second formula only contains a label and is therefore displaying invalid data, which although invisible ruins your graph then.. Have you thought about using a Dual() for your second formula?
The Dual has a text representation part, which will be used for the label and a number representation part, which will be used for displaying the bar.
e.g.
Dual('MyLabel',valid data expression)
- Mark as New
- Bookmark
- Subscribe
- Mute
- Subscribe to RSS Feed
- Permalink
- Report Inappropriate Content
That sounds like a good idea, if i use Dual in the formula of a bar chart and have "Display values in Graph" it will still show the value length and not the label.