Unlock a world of possibilities! Login now and discover the exclusive benefits awaiting you.
- Qlik Community
- :
- All Forums
- :
- QlikView App Dev
- :
- Text formatting for a portion of the label in the ...
- Subscribe to RSS Feed
- Mark Topic as New
- Mark Topic as Read
- Float this Topic for Current User
- Bookmark
- Subscribe
- Mute
- Printer Friendly Page
- Mark as New
- Bookmark
- Subscribe
- Mute
- Subscribe to RSS Feed
- Permalink
- Report Inappropriate Content
Text formatting for a portion of the label in the chart
Hello,
Does anybody know the way to format a portion of column's title in the chart?
Like in example below:
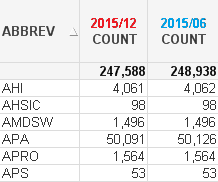
I need to change font's color for Year/Month portion of the header, and keep the "Count" word as is.
Is it possible?
Looking forward for an advice or suggestion.
Best regards,
Vladimir
- Mark as New
- Bookmark
- Subscribe
- Mute
- Subscribe to RSS Feed
- Permalink
- Report Inappropriate Content
I think that this is not possible.
- Mark as New
- Bookmark
- Subscribe
- Mute
- Subscribe to RSS Feed
- Permalink
- Report Inappropriate Content
It's not possible with one object but you could use the dirty trick of using several objects over eachother maybe with textboxes or another table-chart with the label as expression (different colors per condition).
- Marcus
- Mark as New
- Bookmark
- Subscribe
- Mute
- Subscribe to RSS Feed
- Permalink
- Report Inappropriate Content
Marcus, interesting suggestion, but it will not work in my case. Columns are re-sizable, and I have dynamically enabled columns also. So it's impossible to place a text box exactly on top of the column's label....
VK
- Mark as New
- Bookmark
- Subscribe
- Mute
- Subscribe to RSS Feed
- Permalink
- Report Inappropriate Content
Yes textboxes won't work in this case but a second table-chart which contained the labels as expression might work also with conditions to fetch the dynamically enabled columns. Definitely not really nice but maybe a workaround.
- Marcus
- Mark as New
- Bookmark
- Subscribe
- Mute
- Subscribe to RSS Feed
- Permalink
- Report Inappropriate Content
Yes, it might work, but not with re-sizable columns... As far as I know there is no function in QV to get or set the column's width from inside the app....
Have to accept the limitation....
Thanks for suggestions.
Regards,
Vladimir