Unlock a world of possibilities! Login now and discover the exclusive benefits awaiting you.
- Qlik Community
- :
- All Forums
- :
- QlikView App Dev
- :
- The total in the chart
- Subscribe to RSS Feed
- Mark Topic as New
- Mark Topic as Read
- Float this Topic for Current User
- Bookmark
- Subscribe
- Mute
- Printer Friendly Page
- Mark as New
- Bookmark
- Subscribe
- Mute
- Subscribe to RSS Feed
- Permalink
- Report Inappropriate Content
The total in the chart
I have 2 same time-series, which is displayed differently.
First chart plot individual values in 3 timeseries.
Now, how could I plot the total of value in the second graph?

I would appreciate for your feedback in advance.
- Tags:
- chart
- Mark as New
- Bookmark
- Subscribe
- Mute
- Subscribe to RSS Feed
- Permalink
- Report Inappropriate Content
- Mark as New
- Bookmark
- Subscribe
- Mute
- Subscribe to RSS Feed
- Permalink
- Report Inappropriate Content
Hi I studied the feedbacks in the thread, but once I convert it from histogram to area chart, it loses magic. I wonder if we have option to put only total. Maybe it is impossible.
- Mark as New
- Bookmark
- Subscribe
- Mute
- Subscribe to RSS Feed
- Permalink
- Report Inappropriate Content
Hi,
You can enable the values on data points in expression tab
- Mark as New
- Bookmark
- Subscribe
- Mute
- Subscribe to RSS Feed
- Permalink
- Report Inappropriate Content
Hi, the trouble for this option is that it also shows individual values, like first diagram. We only should show total.

- Mark as New
- Bookmark
- Subscribe
- Mute
- Subscribe to RSS Feed
- Permalink
- Report Inappropriate Content
you could have something like this, if its ok for you..

by enabling Totals on dimension limits...

- Mark as New
- Bookmark
- Subscribe
- Mute
- Subscribe to RSS Feed
- Permalink
- Report Inappropriate Content
This option was explored, but we have additional area of total, on top of individuals.

If we enable Values on Data Points, the result is below:

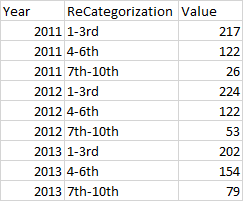
In this timeseries, we have dimention Year and ReCategorization (1-3rd, 4-6th ...), and Expression is just Sum(Value).
Sample data is:

- Mark as New
- Bookmark
- Subscribe
- Mute
- Subscribe to RSS Feed
- Permalink
- Report Inappropriate Content
Probably this is impossible to do. Discussed with client, and approved by adding pivot chart beneath.