Unlock a world of possibilities! Login now and discover the exclusive benefits awaiting you.
- Qlik Community
- :
- All Forums
- :
- QlikView App Dev
- :
- To show values in Line Chart
Options
- Subscribe to RSS Feed
- Mark Topic as New
- Mark Topic as Read
- Float this Topic for Current User
- Bookmark
- Subscribe
- Mute
- Printer Friendly Page
Turn on suggestions
Auto-suggest helps you quickly narrow down your search results by suggesting possible matches as you type.
Showing results for
Specialist II
2014-08-18
12:20 AM
- Mark as New
- Bookmark
- Subscribe
- Mute
- Subscribe to RSS Feed
- Permalink
- Report Inappropriate Content
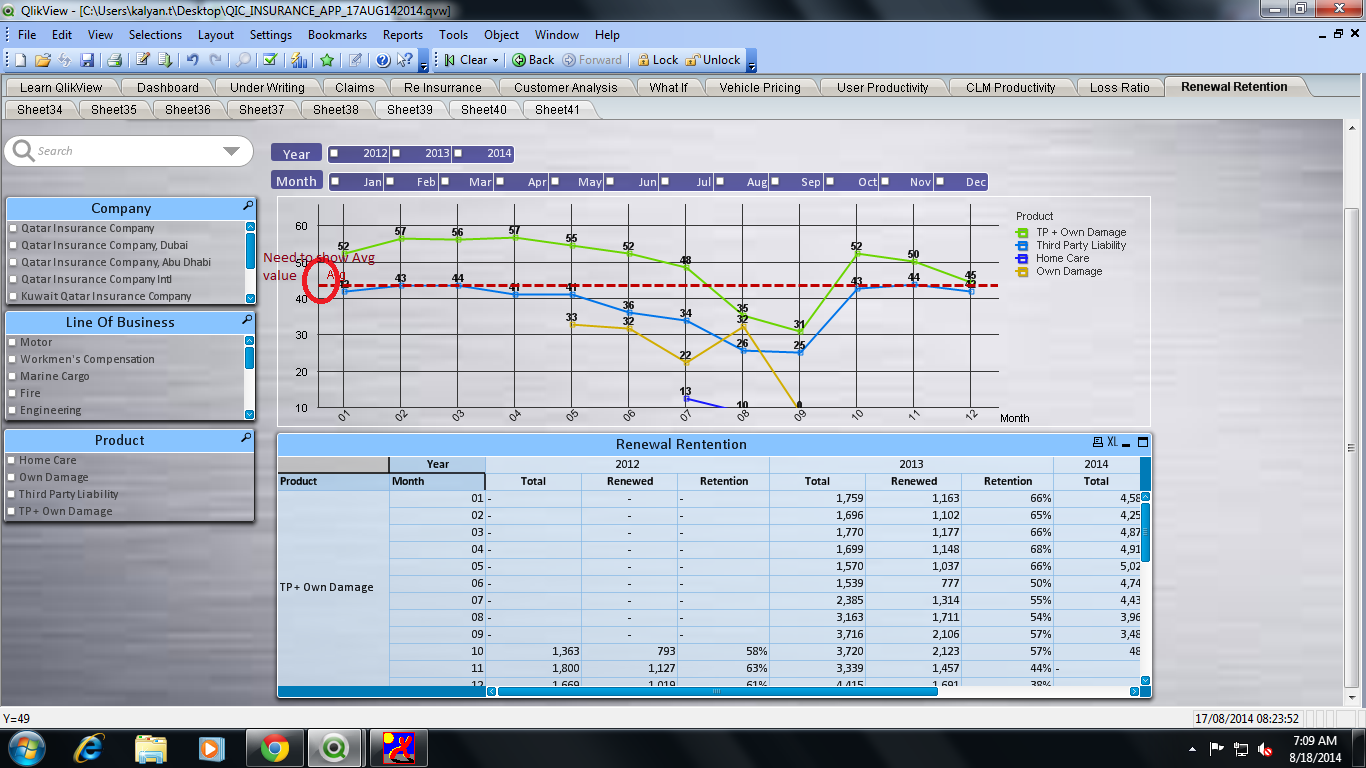
To show values in Line Chart
Hi Friends,
I plotted a line chart and need to show Avg value on it. I added expression in Reference Lines.I couldn't find where to enable option to show value.Please find the below attachment for what i required and suggest me to solve this issue.
Thanks & Regards
Krishna
- Tags:
- new_to_qlikview
2,499 Views
1 Solution
Accepted Solutions
Champion III
2014-08-18
12:54 AM
- Mark as New
- Bookmark
- Subscribe
- Mute
- Subscribe to RSS Feed
- Permalink
- Report Inappropriate Content
2,383 Views
4 Replies
Creator II
2014-08-18
12:32 AM
- Mark as New
- Bookmark
- Subscribe
- Mute
- Subscribe to RSS Feed
- Permalink
- Report Inappropriate Content
2,383 Views
Master III
2014-08-18
12:50 AM
- Mark as New
- Bookmark
- Subscribe
- Mute
- Subscribe to RSS Feed
- Permalink
- Report Inappropriate Content
Here you have to use trick of presenting Text in the chart and the text will have dynamic Avg value.
2,383 Views
Specialist II
2014-08-18
12:50 AM
Author
- Mark as New
- Bookmark
- Subscribe
- Mute
- Subscribe to RSS Feed
- Permalink
- Report Inappropriate Content
Hi Deepak ,
i Enabled the value on data points. I'm getting the values for expressions. But, i'm not getting the values for the expression which i used in Reference lines.
Regards,
Krishna
2,383 Views
Champion III
2014-08-18
12:54 AM
- Mark as New
- Bookmark
- Subscribe
- Mute
- Subscribe to RSS Feed
- Permalink
- Report Inappropriate Content
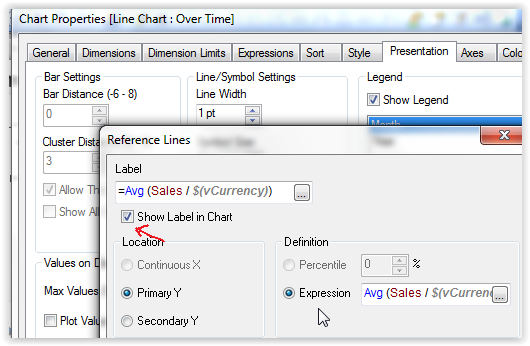
This?
2,384 Views