Unlock a world of possibilities! Login now and discover the exclusive benefits awaiting you.
Announcements
Introducing Qlik Answers: A plug-and-play, Generative AI powered RAG solution.
READ ALL ABOUT IT!
- Qlik Community
- :
- All Forums
- :
- QlikView App Dev
- :
- line chart to show if reading rate goes more than ...
Options
- Subscribe to RSS Feed
- Mark Topic as New
- Mark Topic as Read
- Float this Topic for Current User
- Bookmark
- Subscribe
- Mute
- Printer Friendly Page
Turn on suggestions
Auto-suggest helps you quickly narrow down your search results by suggesting possible matches as you type.
Showing results for
Anonymous
Not applicable
2017-04-13
12:05 PM
- Mark as New
- Bookmark
- Subscribe
- Mute
- Subscribe to RSS Feed
- Permalink
- Report Inappropriate Content
line chart to show if reading rate goes more than 300 (ie) 500 the line chart should come only up to 300 in data points if it cross above 300 it indicate value in bubble image
Hi all,
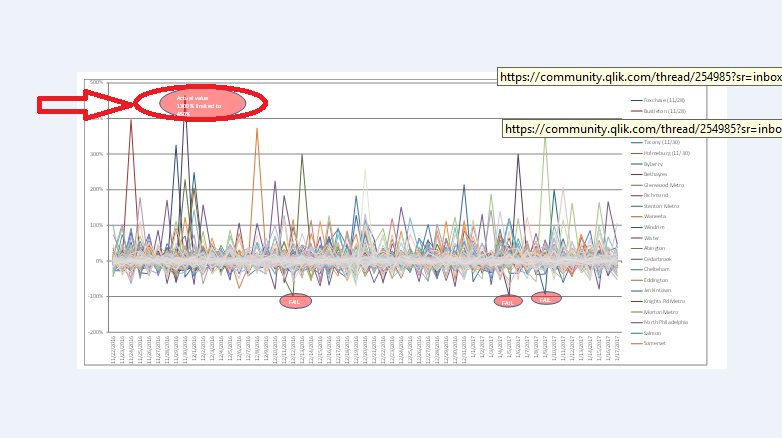
There is a scenario like using a line chart to show if reading rate goes more than 300 (ie) 500 the line chart should come only up to 300
in data points if it cross above 300 it indicate value in bubble image , is it possible in qlikvew like what i am showing in above image
131 Views
0 Replies