Unlock a world of possibilities! Login now and discover the exclusive benefits awaiting you.
- Qlik Community
- :
- All Forums
- :
- QlikView App Dev
- :
- Tooltip in Linear gauge
- Subscribe to RSS Feed
- Mark Topic as New
- Mark Topic as Read
- Float this Topic for Current User
- Bookmark
- Subscribe
- Mute
- Printer Friendly Page
- Mark as New
- Bookmark
- Subscribe
- Mute
- Subscribe to RSS Feed
- Permalink
- Report Inappropriate Content
Tooltip in Linear gauge
Hi All,
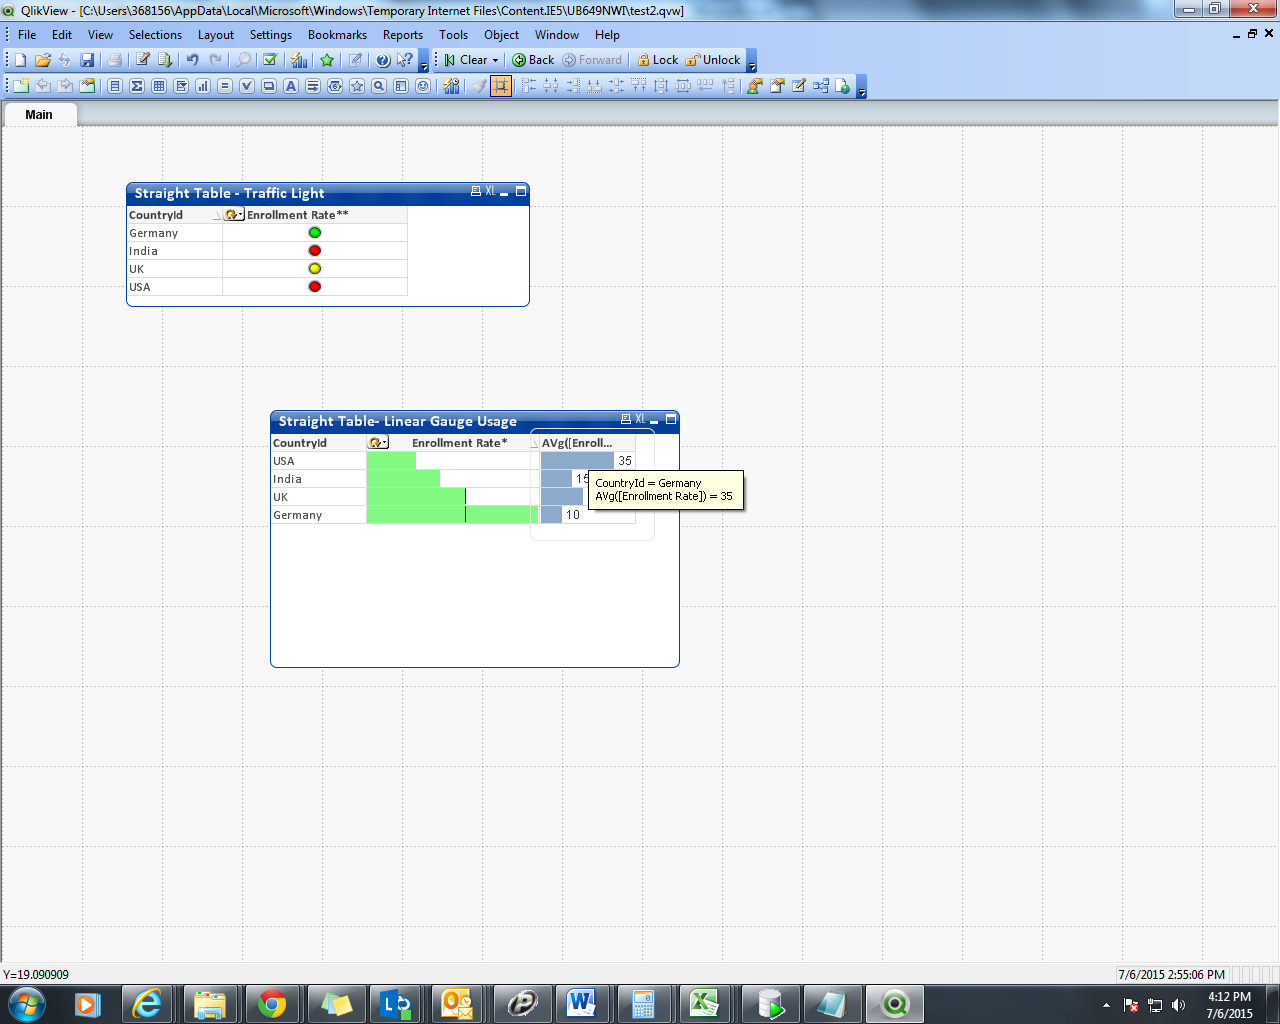
i am using linear gauge in a straight table , in the gauge setting i have created two segments and distinguishing them by different colors. The lower bound of segment 2 is showing the average value.
1. How to add tooltip for this average value ?
2. How to add tooltip for the needle (needle is showing actual value)?
Thanks.
Regards,
Nishith
- Tags:
- new_to_qlikview
- « Previous Replies
-
- 1
- 2
- Next Replies »
- Mark as New
- Bookmark
- Subscribe
- Mute
- Subscribe to RSS Feed
- Permalink
- Report Inappropriate Content
Hi,
Attaching QVW , hope it helps to understand my query.
There are two charts - both are straight table chart but one using traffic light gauge and another using linear gauge. Need to get tooltip for both the types.
Regards,
Nishith
- Mark as New
- Bookmark
- Subscribe
- Mute
- Subscribe to RSS Feed
- Permalink
- Report Inappropriate Content
Hi,
as i know we dnt have that option ...so we can go like this ..i attached qvw also
- « Previous Replies
-
- 1
- 2
- Next Replies »