Unlock a world of possibilities! Login now and discover the exclusive benefits awaiting you.
- Qlik Community
- :
- All Forums
- :
- QlikView App Dev
- :
- Top 10 customers by highest difference comparison ...
- Subscribe to RSS Feed
- Mark Topic as New
- Mark Topic as Read
- Float this Topic for Current User
- Bookmark
- Subscribe
- Mute
- Printer Friendly Page
- Mark as New
- Bookmark
- Subscribe
- Mute
- Subscribe to RSS Feed
- Permalink
- Report Inappropriate Content
Top 10 customers by highest difference comparison with last year
Hi together,
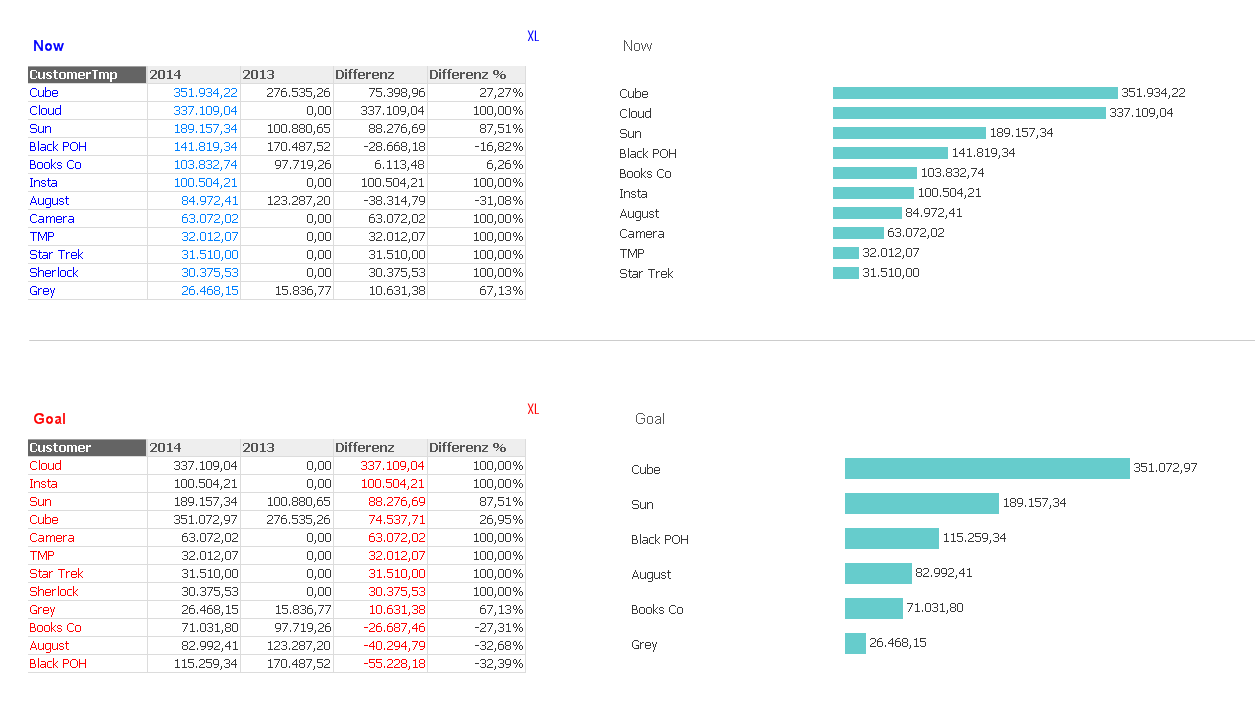
have someone a idea how i could adjust my Expression for this result:
Goal > Top 10 growing customers in a Bar Chart, where the last year not 0,00
http://www.dict.cc/englisch-deutsch/consideration.htmlConsideration > The User have to select one year. The comparison with the last year ensued automatically.
Example
User selected year "2014"
Now: Top 10 Customers 2014

Expression:
Sum({$<customer={'=rank(sum(Jobvalue), 4)<= 10'}>} Jobvalue)

N= Now X= Goal
Dimension: Customer
Expression 2014: sum({$<Year={'$(=GetFieldSelections(Year))'}>} Jobvalue)
Expression 2013: sum({$<Year={'$(=GetFieldSelections(Year)-1)'}>} Jobvalue)
Difference: column(1) - column(2)
Difference %:
if(column(1)= '0' and column(2)= '0', '0,00%', if(column(1)< '0' and column(2)= '0', '-100,00%',
if(column(1)= '0' and column(2)< '0', '100,00%',
if(column(1)= '0', '-100,00%', if(column(2)= '0', '100,00%', if(column(2)< '0', ((column(1) - column(2)) / column(2))*-1,
((column(1) - column(2)) / column(2))))))))
Greetings
Lisa
Accepted Solutions
- Mark as New
- Bookmark
- Subscribe
- Mute
- Subscribe to RSS Feed
- Permalink
- Report Inappropriate Content
Well, in general,almost everything is possible.
In the current bar chart expression, there are two elements to look at:
Sum(
{$<Customer={"=If(sum({$<Year={'$(=GetFieldSelections(Year)-1)'}>} Jobvalue)=0,
0,
rank(
(
sum({$<Year={'$(=GetFieldSelections(Year))'}>} Jobvalue)
/ sum({$<Year={'$(=GetFieldSelections(Year)-1)'}>} Jobvalue)
-1)
, 4)<= 10)
"}>}
Jobvalue)
a) the aggregation function;
Sum( Jobvalue)
b) the set expression
{$<Customer={"=If(sum({$<Year={'$(=GetFieldSelections(Year)-1)'}>} Jobvalue)=0,
0,
rank(
(
sum({$<Year={'$(=GetFieldSelections(Year))'}>} Jobvalue)
/ sum({$<Year={'$(=GetFieldSelections(Year)-1)'}>} Jobvalue)
-1)
, 4)<= 10)
"}>}
a) tells QV what fields you want to aggregate using which function. Ok QV, Sum up Jobvalue, please.
b) tells QV which filter you want to use for the aggregation: get the Top10 customers by YoY comparison.
If you want to show something different, you can adapt both parts, e.g.
= sum(
{$<Year={'$(=GetFieldSelections(Year))'},
Customer={"=If(sum({$<Year={'$(=GetFieldSelections(Year)-1)'}>} Jobvalue)=0,
0,
rank(
(
sum({$<Year={'$(=GetFieldSelections(Year))'}>} Jobvalue)
/ sum({$<Year={'$(=GetFieldSelections(Year)-1)'}>} Jobvalue)
-1)
, 4)<= 10)
>} Jobvalue)
-
sum(
{$<Year={'$(=GetFieldSelections(Year)-1)'},
Customer={"=If(sum({$<Year={'$(=GetFieldSelections(Year)-1)'}>} Jobvalue)=0,
0,
rank(
(
sum({$<Year={'$(=GetFieldSelections(Year))'}>} Jobvalue)
/ sum({$<Year={'$(=GetFieldSelections(Year)-1)'}>} Jobvalue)
-1)
, 4)<= 10)
>} Jobvalue)
Noticed how I've adapted your difference calculation to include the customer filter?
- Mark as New
- Bookmark
- Subscribe
- Mute
- Subscribe to RSS Feed
- Permalink
- Report Inappropriate Content
Maybe like
Sum(
{$<Customer={"=If(sum({$<Year={'$(=GetFieldSelections(Year)-1)'}>} Jobvalue)=0,
0,
rank(
(
sum({$<Year={'$(=GetFieldSelections(Year))'}>} Jobvalue)
/ sum({$<Year={'$(=GetFieldSelections(Year)-1)'}>} Jobvalue)
-1)
, 4)<= 10)
"}>}
Jobvalue)
- Mark as New
- Bookmark
- Subscribe
- Mute
- Subscribe to RSS Feed
- Permalink
- Report Inappropriate Content
Good Morning,
thank you for your fast answer.
Unfortunately the result is not that, what I surch or I have a mistake in the object settings.
Would you perhaps look at the file with the test data?

Lisa
- Mark as New
- Bookmark
- Subscribe
- Mute
- Subscribe to RSS Feed
- Permalink
- Report Inappropriate Content
Could you point me to some values that don't match your expected results?
I think you are using my expression in the lower bar chart, and it seems to me correct, comparing to the chart to its left.
You only have 6 Customer with sales >0 in previous year, so you get at most 6 customers in the bar chart.
- Mark as New
- Bookmark
- Subscribe
- Mute
- Subscribe to RSS Feed
- Permalink
- Report Inappropriate Content
Yes, of course in that case it is correct :-).
And yes in the lower bar chart is your Expression.
I try it in another way: The Users do not want to see the Value of the column 2014
but of the Difference.
Is something of the kind possible?

- Mark as New
- Bookmark
- Subscribe
- Mute
- Subscribe to RSS Feed
- Permalink
- Report Inappropriate Content
Well, in general,almost everything is possible.
In the current bar chart expression, there are two elements to look at:
Sum(
{$<Customer={"=If(sum({$<Year={'$(=GetFieldSelections(Year)-1)'}>} Jobvalue)=0,
0,
rank(
(
sum({$<Year={'$(=GetFieldSelections(Year))'}>} Jobvalue)
/ sum({$<Year={'$(=GetFieldSelections(Year)-1)'}>} Jobvalue)
-1)
, 4)<= 10)
"}>}
Jobvalue)
a) the aggregation function;
Sum( Jobvalue)
b) the set expression
{$<Customer={"=If(sum({$<Year={'$(=GetFieldSelections(Year)-1)'}>} Jobvalue)=0,
0,
rank(
(
sum({$<Year={'$(=GetFieldSelections(Year))'}>} Jobvalue)
/ sum({$<Year={'$(=GetFieldSelections(Year)-1)'}>} Jobvalue)
-1)
, 4)<= 10)
"}>}
a) tells QV what fields you want to aggregate using which function. Ok QV, Sum up Jobvalue, please.
b) tells QV which filter you want to use for the aggregation: get the Top10 customers by YoY comparison.
If you want to show something different, you can adapt both parts, e.g.
= sum(
{$<Year={'$(=GetFieldSelections(Year))'},
Customer={"=If(sum({$<Year={'$(=GetFieldSelections(Year)-1)'}>} Jobvalue)=0,
0,
rank(
(
sum({$<Year={'$(=GetFieldSelections(Year))'}>} Jobvalue)
/ sum({$<Year={'$(=GetFieldSelections(Year)-1)'}>} Jobvalue)
-1)
, 4)<= 10)
>} Jobvalue)
-
sum(
{$<Year={'$(=GetFieldSelections(Year)-1)'},
Customer={"=If(sum({$<Year={'$(=GetFieldSelections(Year)-1)'}>} Jobvalue)=0,
0,
rank(
(
sum({$<Year={'$(=GetFieldSelections(Year))'}>} Jobvalue)
/ sum({$<Year={'$(=GetFieldSelections(Year)-1)'}>} Jobvalue)
-1)
, 4)<= 10)
>} Jobvalue)
Noticed how I've adapted your difference calculation to include the customer filter?
- Mark as New
- Bookmark
- Subscribe
- Mute
- Subscribe to RSS Feed
- Permalink
- Report Inappropriate Content
Great! It works ... You were very helpful.
I have just add the lost (") at the End in both parts.
sum({$<Year={'$(=GetFieldSelections(Year)-1)'},
Customer={"![]() =If(sum({$<Year={'$(=GetFieldSelections(Year)-1)'}>} Jobvalue)=0,0,
=If(sum({$<Year={'$(=GetFieldSelections(Year)-1)'}>} Jobvalue)=0,0,
rank((sum({$<Year={'$(=GetFieldSelections(Year))'}>} Jobvalue)
/ sum({$<Year={'$(=GetFieldSelections(Year)-1)'}>} Jobvalue)-1), 4)<= 10)![]() >} Jobvalue)
>} Jobvalue)
Yes, I noticed how you nest the expressions. Then I know now how I have to package the If 🙂 and
several parts. Thank you for the detailed description.
Nice afternoon.
Greetings
Lisa