Unlock a world of possibilities! Login now and discover the exclusive benefits awaiting you.
- Qlik Community
- :
- All Forums
- :
- QlikView App Dev
- :
- Top 10 product sales over 10 weeks
Options
- Subscribe to RSS Feed
- Mark Topic as New
- Mark Topic as Read
- Float this Topic for Current User
- Bookmark
- Subscribe
- Mute
- Printer Friendly Page
Turn on suggestions
Auto-suggest helps you quickly narrow down your search results by suggesting possible matches as you type.
Showing results for
Anonymous
Not applicable
2018-02-04
10:24 PM
- Mark as New
- Bookmark
- Subscribe
- Mute
- Subscribe to RSS Feed
- Permalink
- Report Inappropriate Content
Top 10 product sales over 10 weeks
Hi,
I have multiple products and want to get the top 10 products based on the total sales of the product in each week.
I will be using this in a line chart which will show the sales trend of the top 10 products across 10 weeks. It keeps giving me more than 10 products which is not what i wanted. Are there any ways to do it in data load editor?
588 Views
3 Replies
2018-02-05
07:35 PM
- Mark as New
- Bookmark
- Subscribe
- Mute
- Subscribe to RSS Feed
- Permalink
- Report Inappropriate Content
First step, can u try this im UI?
If(aggr(rank(sum(TOTAL <week> sales))<=10, product), product)
Best Anil, When applicable please mark the correct/appropriate replies as "solution" (you can mark up to 3 "solutions". Please LIKE threads if the provided solution is helpful
479 Views
Anonymous
Not applicable
2018-02-05
10:29 PM
Author
- Mark as New
- Bookmark
- Subscribe
- Mute
- Subscribe to RSS Feed
- Permalink
- Report Inappropriate Content
It doesn't display anything? Only a straight line is shown
479 Views
Anonymous
Not applicable
2018-02-05
10:30 PM
Author
- Mark as New
- Bookmark
- Subscribe
- Mute
- Subscribe to RSS Feed
- Permalink
- Report Inappropriate Content
I have done an example of how i wanted it in Excel. I use filters to achieve this. 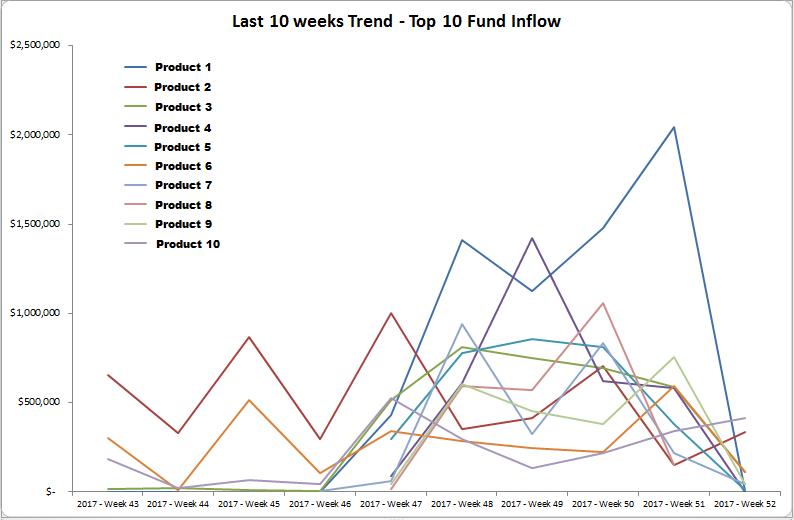
479 Views