Unlock a world of possibilities! Login now and discover the exclusive benefits awaiting you.
- Qlik Community
- :
- All Forums
- :
- QlikView App Dev
- :
- Top 3 Chart - Aggr + Rank + Set Analysis
- Subscribe to RSS Feed
- Mark Topic as New
- Mark Topic as Read
- Float this Topic for Current User
- Bookmark
- Subscribe
- Mute
- Printer Friendly Page
- Mark as New
- Bookmark
- Subscribe
- Mute
- Subscribe to RSS Feed
- Permalink
- Report Inappropriate Content
Top 3 Chart - Aggr + Rank + Set Analysis
Gents,
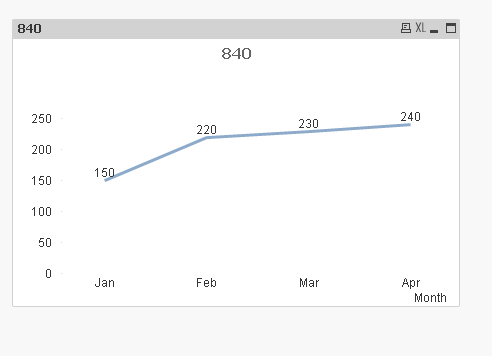
I'm struggling in create a new line chart with my "top 3" ranking data.
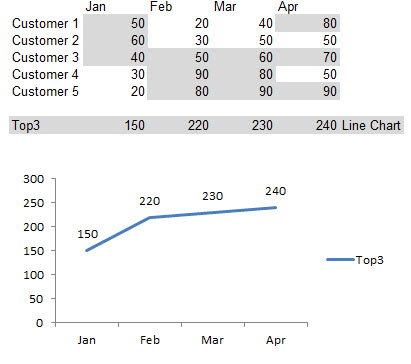
My goal is figure out the top "3" customers for each period and plot in a chart, as the picture below.
I think I'm closer to the solution using Aggr+Rank, but my results does not match yet. Any clue in the final expression?
Thanks in advance.
Accepted Solutions
- Mark as New
- Bookmark
- Subscribe
- Mute
- Subscribe to RSS Feed
- Permalink
- Report Inappropriate Content
Try an expression in your line chart like
=Sum( Aggr( If(Rank(Sum( Value)) <=3, Sum(Value)), Month, Customer))
edit: changed Aggr() dimension order.
- Mark as New
- Bookmark
- Subscribe
- Mute
- Subscribe to RSS Feed
- Permalink
- Report Inappropriate Content
Hi Fabio,
Can you please attach your qvw file?
Thanks,
MB
- Mark as New
- Bookmark
- Subscribe
- Mute
- Subscribe to RSS Feed
- Permalink
- Report Inappropriate Content
Try an expression in your line chart like
=Sum( Aggr( If(Rank(Sum( Value)) <=3, Sum(Value)), Month, Customer))
edit: changed Aggr() dimension order.
- Mark as New
- Bookmark
- Subscribe
- Mute
- Subscribe to RSS Feed
- Permalink
- Report Inappropriate Content
May be this:
Expression: =Sum(Aggr(If(Rank(Value, 0, 1) <= 3, Value), Month, Customer))