Unlock a world of possibilities! Login now and discover the exclusive benefits awaiting you.
- Qlik Community
- :
- All Forums
- :
- QlikView App Dev
- :
- Top X% of Customers = Y% of Sales
- Subscribe to RSS Feed
- Mark Topic as New
- Mark Topic as Read
- Float this Topic for Current User
- Bookmark
- Subscribe
- Mute
- Printer Friendly Page
- Mark as New
- Bookmark
- Subscribe
- Mute
- Subscribe to RSS Feed
- Permalink
- Report Inappropriate Content
Top X% of Customers = Y% of Sales
Hello,
I´m trying to design a chart with a slider that is related to a variable. Currently when I use that slider then the chart will show the customers that contribute to Y% of Sales (column Accumulated %). But that´s not what I would like to do. Instead I would like to choose my top X% customers and see to how much of the total Sales they contribute. Therefore the slider and the variable need to be connected to the fomula in the column: Count Of customers in Total in %. With the column Rank I arrange the sort order.
This is my chart to far:
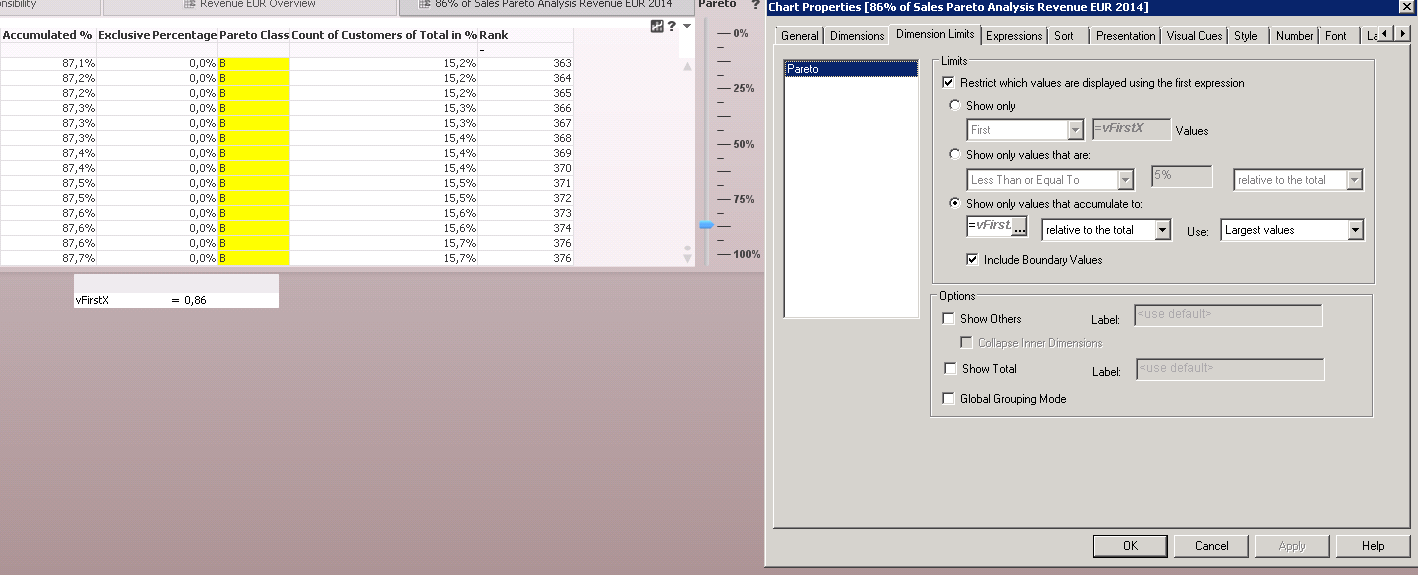
This is the formula for Count of Customers in Total in %:
=(rank($(=vCalcTotalYear1)) ) / (sum(total(aggr(count({$<FYear = {$(vChooseYear1)}, OrderPhase_Desc = {$(vOrderPhaseDesc)}, SoldToBusinessPartnerCount = {1}>} distinct SoldToBusinessPartnerCount), SoldToBusinessPartner))) )
Many thanks for your ideas.
Best regards,
Carolin