Unlock a world of possibilities! Login now and discover the exclusive benefits awaiting you.
- Qlik Community
- :
- All Forums
- :
- QlikView App Dev
- :
- Re: Total function in chart
- Subscribe to RSS Feed
- Mark Topic as New
- Mark Topic as Read
- Float this Topic for Current User
- Bookmark
- Subscribe
- Mute
- Printer Friendly Page
- Mark as New
- Bookmark
- Subscribe
- Mute
- Subscribe to RSS Feed
- Permalink
- Report Inappropriate Content
Total function in chart
Hello to all,
I'm having some issues on the creation of a chart with the % of expenses for my 3 years database.
I have the following kinds of expenses:
Administration;
Computer;
Distribution;
Production;
Selling;
Technical.
I wish to build a line chart in which each line stands for each kind of expense, as the % of the total.
I made a brief, in a child way, to demonstrate the chart I need.
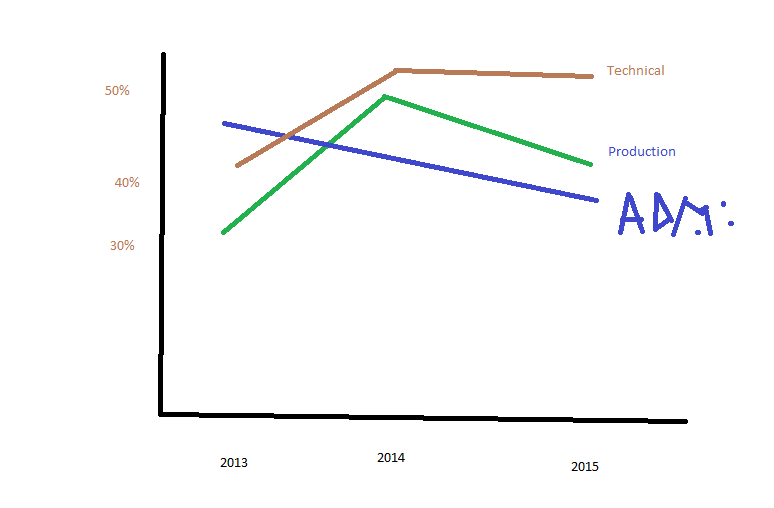
In my Dashboard, the Year field is always selected, so, it's something to take into consideration that makes it harder to set a good set analysis.
Thanks a lot guys!!!!!!
- Mark as New
- Bookmark
- Subscribe
- Mute
- Subscribe to RSS Feed
- Permalink
- Report Inappropriate Content
May be this:
Sum({<Year, Expenses = {'Administration'}>}Expenses)/Sum({<Year>}Expenses)
Sum({<Year, Expenses = {'Computer'}>}Expenses)/Sum({<Year>}Expenses)
Sum({<Year, Expenses = {'Distribution'}>}Expenses)/Sum({<Year>}Expenses)
Sum({<Year, Expenses = {'Production'}>}Expenses)/Sum({<Year>}Expenses)
Sum({<Year, Expenses = {'Selling'}>}Expenses)/Sum({<Year>}Expenses)
Sum({<Year, Expenses = {'Technical'}>}Expenses)/Sum({<Year>}Expenses)
- Mark as New
- Bookmark
- Subscribe
- Mute
- Subscribe to RSS Feed
- Permalink
- Report Inappropriate Content
Sunny T,
It worked very well.
Thanks a lot!!!!
- Mark as New
- Bookmark
- Subscribe
- Mute
- Subscribe to RSS Feed
- Permalink
- Report Inappropriate Content
Great 