Unlock a world of possibilities! Login now and discover the exclusive benefits awaiting you.
- Qlik Community
- :
- All Forums
- :
- QlikView App Dev
- :
- Re: Total in Pivot Table...
- Subscribe to RSS Feed
- Mark Topic as New
- Mark Topic as Read
- Float this Topic for Current User
- Bookmark
- Subscribe
- Mute
- Printer Friendly Page
- Mark as New
- Bookmark
- Subscribe
- Mute
- Subscribe to RSS Feed
- Permalink
- Report Inappropriate Content
Total in Pivot Table...
Hi Guys,
i have a pivot table with two dimensions and one expression.
see the sample image.
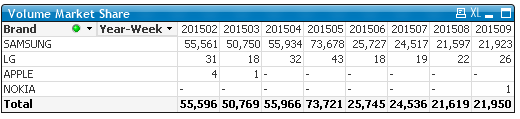
i have more than 50 brands, in a list box, let say i selected 4 brands, now the partial sum(Total) is for selected 4 brands only,
but i want to show the whole sum(Total) for all brands. or if i could show an other row as 'Others' then the partial sum can be correct.
but i dont know ,how to do it...The total row must be for all brands, does matter whatever is selected in brands...
Many Thanks..
Accepted Solutions
- Mark as New
- Bookmark
- Subscribe
- Mute
- Subscribe to RSS Feed
- Permalink
- Report Inappropriate Content
Try this:
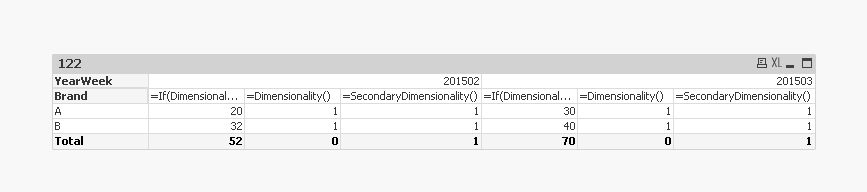
If(Dimensionality() = 0, Sum({1} Sales), Sum(Sales)) //Replace Sum(Sales with your expression, just add {1} to the true condition.
Attaching a sample with dummy data. Hope that helps.
Best,
Sunny
- Mark as New
- Bookmark
- Subscribe
- Mute
- Subscribe to RSS Feed
- Permalink
- Report Inappropriate Content
Try this:
If(Dimensionality() = 0, Sum({1} Sales), Sum(Sales)) //Replace Sum(Sales with your expression, just add {1} to the true condition.
Attaching a sample with dummy data. Hope that helps.
Best,
Sunny
- Mark as New
- Bookmark
- Subscribe
- Mute
- Subscribe to RSS Feed
- Permalink
- Report Inappropriate Content
worked...
Many thanks..
little confuse about the expression, can you please elaborate a bit.
i think in my case, Dimensionality() will be 1 all the time?
and i have read that , the dimensionality start from 1 to upward.
when it can be zero?
many thanks...
- Mark as New
- Bookmark
- Subscribe
- Mute
- Subscribe to RSS Feed
- Permalink
- Report Inappropriate Content
Add an expression: Dimensionality() and SecondaryDimensionality() in your existing chart and you will know which sub-total has what Dimensionality() and SecondaryDimensionality(). This you can then refer in your main expression based on which combinations needs to do what. SecondaryDimensionality() is only used in a pivot table (but I thought I will explain its use as well)
I hope this will help. For more info on Dimensionality you can check the info by Robert_Mika: How to use - Dimensionality()
HTH
Best,
Sunny