Unlock a world of possibilities! Login now and discover the exclusive benefits awaiting you.
- Qlik Community
- :
- All Forums
- :
- QlikView App Dev
- :
- Re: Totals not working in pivot table
- Subscribe to RSS Feed
- Mark Topic as New
- Mark Topic as Read
- Float this Topic for Current User
- Bookmark
- Subscribe
- Mute
- Printer Friendly Page
- Mark as New
- Bookmark
- Subscribe
- Mute
- Subscribe to RSS Feed
- Permalink
- Report Inappropriate Content
Totals not working in pivot table
Hello
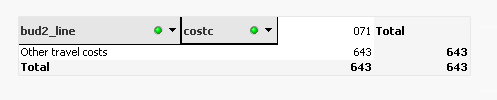
I have a table that shows 643 when I just show bud2_line and costc in the pivot table and straight table.
I know this value should be 752

When I add an extra dimension 'text' to the straight table which shows individual lines then the total suddenly becomes the correct number
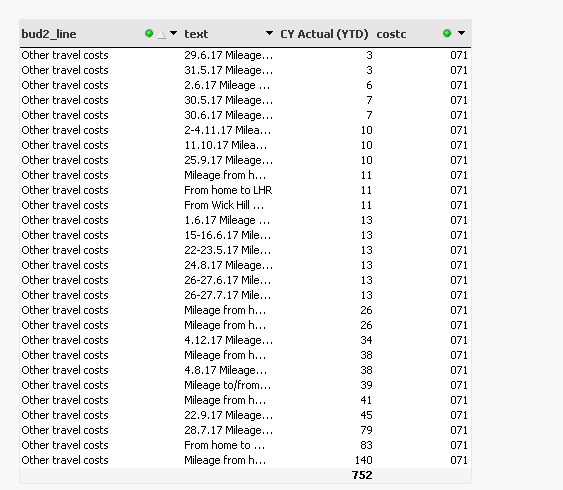
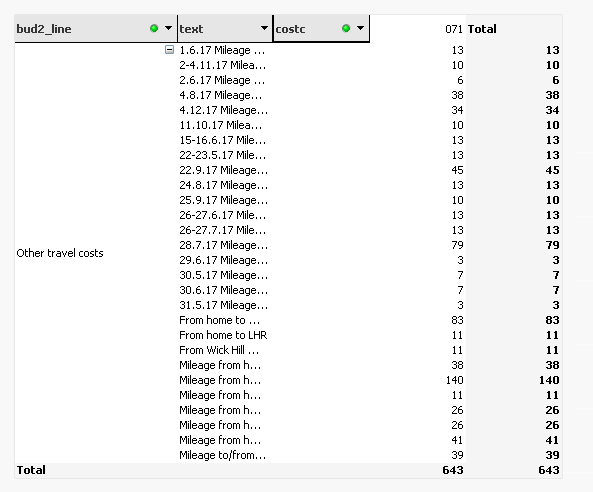
The pivot table still shows the wrong number ie the individual rows add up to 752 in the pivot table not 643
This is the expression
sum({$<period = {">=$(vStartPeriod_CY)<=$(vEndPeriod_CY)"},
bud2 = {">0"},
DataSource = {"Agresso"}
>} $(vCurrency))
Could you please help me understand why
a) the straight table total only works with the Text dimension added
b) why the pivot table doesn't work at all even when I add the text
Many thanks
Paul
Accepted Solutions
- Mark as New
- Bookmark
- Subscribe
- Mute
- Subscribe to RSS Feed
- Permalink
- Report Inappropriate Content
Try this may be
Sum(Aggr(
Sum({$<period = {">=$(vStartPeriod_CY)<=$(vEndPeriod_CY)"}, bud2 = {">0"}, DataSource = {"Agresso"}>} $(vCurrency))
, bud2_line, text, costc))
- Mark as New
- Bookmark
- Subscribe
- Mute
- Subscribe to RSS Feed
- Permalink
- Report Inappropriate Content
Try this may be
Sum(Aggr(
Sum({$<period = {">=$(vStartPeriod_CY)<=$(vEndPeriod_CY)"}, bud2 = {">0"}, DataSource = {"Agresso"}>} $(vCurrency))
, bud2_line, text, costc))
- Mark as New
- Bookmark
- Subscribe
- Mute
- Subscribe to RSS Feed
- Permalink
- Report Inappropriate Content
Hi Sunny
Thanks so much for your help, that worked!
Paul