Unlock a world of possibilities! Login now and discover the exclusive benefits awaiting you.
- Qlik Community
- :
- All Forums
- :
- QlikView App Dev
- :
- Re: Transform W201613 to Week number like 13
- Subscribe to RSS Feed
- Mark Topic as New
- Mark Topic as Read
- Float this Topic for Current User
- Bookmark
- Subscribe
- Mute
- Printer Friendly Page
- Mark as New
- Bookmark
- Subscribe
- Mute
- Subscribe to RSS Feed
- Permalink
- Report Inappropriate Content
Transform W201613 to Week number like 13
Hi,
Does anyone know if I can transform in a Line Chart / Dimension the week format from W201613 to 13?
Regards,
C
- « Previous Replies
-
- 1
- 2
- Next Replies »
Accepted Solutions
- Mark as New
- Bookmark
- Subscribe
- Mute
- Subscribe to RSS Feed
- Permalink
- Report Inappropriate Content
- Mark as New
- Bookmark
- Subscribe
- Mute
- Subscribe to RSS Feed
- Permalink
- Report Inappropriate Content
hello Constantin,
try this in Dimension.
right(Week,2)
regards
tim
- Mark as New
- Bookmark
- Subscribe
- Mute
- Subscribe to RSS Feed
- Permalink
- Report Inappropriate Content
Hi this works for me now thanks. Now i just discovered that the weeks are not in the right possition.
I have something like this 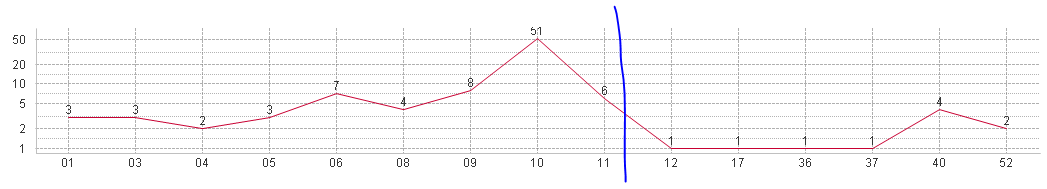
The problem is... everything before 11 is 2017 data and all the rest are 2016 ... I used in the expression this calculation =count({$<Status= {'WP'}, CalendarPeriodnum={'>= $(=num(WeekStart(AddWeeks(max(CalendarPeriod),-15)))) <= $(=num(WeekEnd(max(CalendarPeriod))))'},YrWeek=,CalendarYear=>}TICKETID) and I think.
Any advices ?
I want the maximum week - 16
- Mark as New
- Bookmark
- Subscribe
- Mute
- Subscribe to RSS Feed
- Permalink
- Report Inappropriate Content
can you share a sample qvw?
- Mark as New
- Bookmark
- Subscribe
- Mute
- Subscribe to RSS Feed
- Permalink
- Report Inappropriate Content
I can't do this.... I think my Yrweek is not right and maybe i need to create a new YRWeek and order them asc. it is this right?
- Mark as New
- Bookmark
- Subscribe
- Mute
- Subscribe to RSS Feed
- Permalink
- Report Inappropriate Content
i think max(CalendarPeriod) is the Problem at this Point. Please check this value.
- Mark as New
- Bookmark
- Subscribe
- Mute
- Subscribe to RSS Feed
- Permalink
- Report Inappropriate Content
I changed the dimension into =DATE#(date#(RIGHT(OP.YrWeek,2))) and the expression into =count({$<Status= {'WP'}>}TICKETID) and now I have this:

This is right now only the problem is I want to display only the last 15 weeks. I tried the dimension limits but all the files with no data would go and I want to show the weeks with no data to.
- Mark as New
- Bookmark
- Subscribe
- Mute
- Subscribe to RSS Feed
- Permalink
- Report Inappropriate Content
you could try this as Dimension:
=if(CalendarPeriodnum>= num(WeekStart(AddWeeks(max(CalendarPeriod),-15)))
AND CalendarPeriodnum <= num(WeekEnd(max(CalendarPeriod))), DATE#(date#(RIGHT(OP.YrWeek,2))))
Leave the Checkbox "Suppres Null Value" unticked to Display other weeks too.
- Mark as New
- Bookmark
- Subscribe
- Mute
- Subscribe to RSS Feed
- Permalink
- Report Inappropriate Content
I think something is wrong with the above code because the AddWeeks is highlighted with red and all the function after this they are not colored in blue...
Could you please write all the code including my condition for a specific status?
This is my dimension =count({$<Status= {'WP'}, CalendarPeriodnum={'>= $(=num(WeekStart(AddWeeks(max(CalendarPeriod),-15)))) <= $(=num(WeekEnd(max(CalendarPeriod))))'},YrWeek=,CalendarYear=>}TICKETID)
and I tried to include your code like this:
=count({$<Status= {'WP'},=if(CalendarPeriodnum>= num(WeekStart(AddWeeks(max(CalendarPeriod),-15)))
AND CalendarPeriodnum <= num(WeekEnd(max(CalendarPeriod))), DATE#(date#(RIGHT(OP.YrWeek,2))))>},TICKETID)
- Mark as New
- Bookmark
- Subscribe
- Mute
- Subscribe to RSS Feed
- Permalink
- Report Inappropriate Content
Please ignore my preview replay. I tried now in the dimension and the AddWeeks highlighted with red and all the function after this they are not colored in blue...
- « Previous Replies
-
- 1
- 2
- Next Replies »