Unlock a world of possibilities! Login now and discover the exclusive benefits awaiting you.
- Qlik Community
- :
- All Forums
- :
- QlikView App Dev
- :
- Re: Transforming month values in Fields
- Subscribe to RSS Feed
- Mark Topic as New
- Mark Topic as Read
- Float this Topic for Current User
- Bookmark
- Subscribe
- Mute
- Printer Friendly Page
- Mark as New
- Bookmark
- Subscribe
- Mute
- Subscribe to RSS Feed
- Permalink
- Report Inappropriate Content
Transforming month values in Fields
Hello everyone,
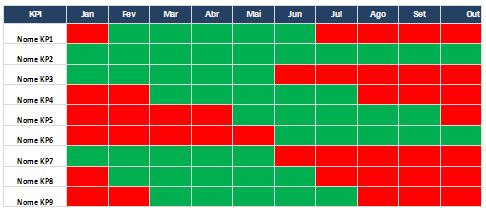
I need to create a table which display the status green or red by month. Something like that:
My data base have a field called "Month" and another one called "Status Month" (that has the values Red or Green in text).
Anyone know how can i set the months as a field into the table, like in the example above?
It is possible to increase the table with the next months when the data base is populated? For example, today my data base doesn´t have data from december, but when this get updated, the table should display data from december in the right hand side column of the table.
Regards
- Tags:
- new_to_qlikview
Accepted Solutions
- Mark as New
- Bookmark
- Subscribe
- Mute
- Subscribe to RSS Feed
- Permalink
- Report Inappropriate Content
Create a pivot table chart with dimensions KPI and Month and expression
=only([Status Month])
Drag the Month dimension to the top using the mouse.
If more month are added, they will appear automatically in the table.
Is this what you are looking for?
You can color the cells in a background color attribute expression:
=If( [Status Month] = 'Red', Lightred(), Lightgreen() )
- Mark as New
- Bookmark
- Subscribe
- Mute
- Subscribe to RSS Feed
- Permalink
- Report Inappropriate Content
Use a Pivot Table with Dimensions of KPI and Month, then drag the Month to the top.
When new Months are loaded into your qvw then they will appear in the Pivot Table.
- Mark as New
- Bookmark
- Subscribe
- Mute
- Subscribe to RSS Feed
- Permalink
- Report Inappropriate Content
Create a pivot table chart with dimensions KPI and Month and expression
=only([Status Month])
Drag the Month dimension to the top using the mouse.
If more month are added, they will appear automatically in the table.
Is this what you are looking for?
You can color the cells in a background color attribute expression:
=If( [Status Month] = 'Red', Lightred(), Lightgreen() )
- Mark as New
- Bookmark
- Subscribe
- Mute
- Subscribe to RSS Feed
- Permalink
- Report Inappropriate Content
Thanks guys, i appreciate your help.
I tryed to color the cells in a background color as you suggested, but it shows the RGB code, as you can see below:
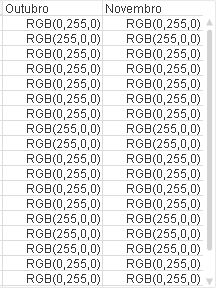
What is missing to display the color?
Thanks
- Mark as New
- Bookmark
- Subscribe
- Mute
- Subscribe to RSS Feed
- Permalink
- Report Inappropriate Content
You need to use the color expression in the background color attribute expression, open the attributes by clicking on the small plus sign next to the expressions (on expression tab of chart properties).
- Mark as New
- Bookmark
- Subscribe
- Mute
- Subscribe to RSS Feed
- Permalink
- Report Inappropriate Content
Thank you swuehl.
I am almost there! Now i ned to remove the text from the cell, and just display the color. See:
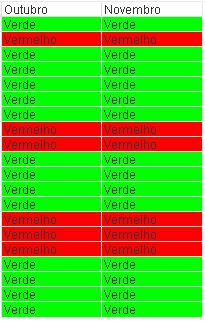
Thanks
- Mark as New
- Bookmark
- Subscribe
- Mute
- Subscribe to RSS Feed
- Permalink
- Report Inappropriate Content
Make your expression be:
=' '
-Rob
- Mark as New
- Bookmark
- Subscribe
- Mute
- Subscribe to RSS Feed
- Permalink
- Report Inappropriate Content
Or put the same colour expression for text as background.
- Mark as New
- Bookmark
- Subscribe
- Mute
- Subscribe to RSS Feed
- Permalink
- Report Inappropriate Content
- Mark as New
- Bookmark
- Subscribe
- Mute
- Subscribe to RSS Feed
- Permalink
- Report Inappropriate Content
Thanks guys.