Unlock a world of possibilities! Login now and discover the exclusive benefits awaiting you.
- Qlik Community
- :
- All Forums
- :
- QlikView App Dev
- :
- Translate Monthly YTD figures to actual Month figu...
- Subscribe to RSS Feed
- Mark Topic as New
- Mark Topic as Read
- Float this Topic for Current User
- Bookmark
- Subscribe
- Mute
- Printer Friendly Page
- Mark as New
- Bookmark
- Subscribe
- Mute
- Subscribe to RSS Feed
- Permalink
- Report Inappropriate Content
Translate Monthly YTD figures to actual Month figures
Hello Qlik gurus!
I have some data that I'm working with that stores a metric with a financial figure per month. So it looks something like this (very simplified)
| Metric | Date | Figure |
|---|---|---|
| Metric 1 | Aug 2016 | 10 |
| Metric 1 | Sep 2016 | 25 |
| Metric 1 | Oct 2016 | 35 |
The problem is that the number in the Figure column is cumulative for the year. So in this example the actual month figure for Oct 2016 was not 35, it was 10. 10 for Aug, 15 for Sep and 10 for Oct adds up to 35. I need to get the actual month figures for each month by subtracting the figure for the previous month from the target month. So the output I want would be this:
| Metric | Date | Figure |
|---|---|---|
| Metric 1 | Aug 2016 | 10 |
| Metric 1 | Sep 2016 | 15 |
| Metric 1 | Oct 2016 | 10 |
I know this could be fairly easily done on the presentation side, but these numbers are used in so many places in the final dashboard that I would rather just convert the data once on the ETL side. I've thought about looping through the original table and doing a lookup for each row to find the previous month figure. However, this is several hundred thousand rows, and that seems really intensive. I was looking into "Preceding Loads" as well, but can't wrap my head around how I might use it in this case.
Any other thoughts or suggestions on how I might accomplish this? Many thanks.
- Tags:
- qlikview_scripting
Accepted Solutions
- Mark as New
- Bookmark
- Subscribe
- Mute
- Subscribe to RSS Feed
- Permalink
- Report Inappropriate Content
And looking at Oleg's response made me realize that second condition in if might have to removed or changed based on the data and requirement when a month is not available in between)
Table:
LOAD Metric,
Date(Date#(Date, 'MMM YYYY'), 'MMM YYYY') as Date,
Figure;
LOAD * INLINE [
Metric, Date, Figure
Metric 1, Aug 2016, 10
Metric 1, Sep 2016, 25
Metric 1, Oct 2016, 35
];
FinalTable:
LOAD Metric,
Date,
Figure,
If(Metric = Previous(Metric) and Date = AddMonths(Previous(Date), 1), RangeSum(Figure, -Peek('Figure')), Figure) as NonCumFigure
Resident Table;
DROP Table Table;
- Mark as New
- Bookmark
- Subscribe
- Mute
- Subscribe to RSS Feed
- Permalink
- Report Inappropriate Content
May be using Peek()/Previous()
Table:
LOAD Metric,
Date(Date#(Date, 'MMM YYYY'), 'MMM YYYY') as Date,
Figure;
LOAD * INLINE [
Metric, Date, Figure
Metric 1, Aug 2016, 10
Metric 1, Sep 2016, 25
Metric 1, Oct 2016, 35
];
FinalTable:
LOAD Metric,
Date,
Figure,
If(Metric = Previous(Metric) and Date = AddMonths(Previous(Date), 1), RangeSum(Figure, -Peek('Figure')), Figure) as NonCumFigure
Resident Table;
DROP Table Table;
- Mark as New
- Bookmark
- Subscribe
- Mute
- Subscribe to RSS Feed
- Permalink
- Report Inappropriate Content
Hi Adam,
you go it right, looping through your data could be extremely slow. However, you can do the same using the functions peek() and Previous(). The two functions are similar, yet slightly different (look them up in the Help sections).
If you reload your data using a Resident load and sort the data in the correct chronological order, then you can reach into the previously loaded row and get the previous number of the Figure and subtract it from the current value of the Figure to calculate the current value:
IF( Peek('Metric') = Metric, Figure - Previous(Figure), Figure) as NetFigure
You can learn more about Peek() vs. Previous() from a variety of sources, including my book QlikView Your Business.
cheers,
Oleg Troyansky
Upgrade your Qlik skills at the Masters Summit for Qlik - coming soon to Munich, Germany!
- Mark as New
- Bookmark
- Subscribe
- Mute
- Subscribe to RSS Feed
- Permalink
- Report Inappropriate Content
Hi Adam
Try, if the script
Directory;
LOAD Metric,
Date,
rangesum (Figure,-Previous(Figure)) as Figure
FROM....
Regards
Andrey
- Mark as New
- Bookmark
- Subscribe
- Mute
- Subscribe to RSS Feed
- Permalink
- Report Inappropriate Content
And looking at Oleg's response made me realize that second condition in if might have to removed or changed based on the data and requirement when a month is not available in between)
Table:
LOAD Metric,
Date(Date#(Date, 'MMM YYYY'), 'MMM YYYY') as Date,
Figure;
LOAD * INLINE [
Metric, Date, Figure
Metric 1, Aug 2016, 10
Metric 1, Sep 2016, 25
Metric 1, Oct 2016, 35
];
FinalTable:
LOAD Metric,
Date,
Figure,
If(Metric = Previous(Metric) and Date = AddMonths(Previous(Date), 1), RangeSum(Figure, -Peek('Figure')), Figure) as NonCumFigure
Resident Table;
DROP Table Table;
- Mark as New
- Bookmark
- Subscribe
- Mute
- Subscribe to RSS Feed
- Permalink
- Report Inappropriate Content
Thank you! I had no idea that Previous existed. So handy. However, now I have created a new problem for myself. Let's say the new example data is as follows:
| Metric | Date | Figure |
|---|---|---|
| Metric 1 | Aug 2016 | 10 |
| Metric 1 | Sep 2016 | 0 |
| Metric 1 | Oct 2016 | 0 |
| Metric 1 | Nov 2016 | 25 |
| Metric 1 | Dec 2016 | 35 |
The problem comes when I hit the Nov record. If it just examines the previous month then evaluates 25 - 0, but the desired output is as follows:
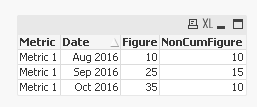
| Metric | Date | Figure |
|---|---|---|
| Metric 1 | Aug 2016 | 10 |
| Metric 1 | Sep 2016 | 0 |
| Metric 1 | Oct 2016 | 0 |
| Metric 1 | Nov 2016 | 15 |
| Metric 1 | Dec 2016 | 10 |
Is there a way to use Previous to go back an arbitrary number of records until one is found without a zero value? I know this seems silly since it's a cumulative YTD figure (should be a figure each month), but unfortunately, if there has been no additional numbers for a month, they report nothing.
- Mark as New
- Bookmark
- Subscribe
- Mute
- Subscribe to RSS Feed
- Permalink
- Report Inappropriate Content
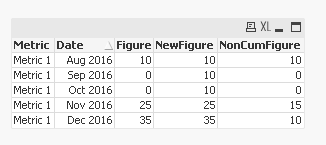
May be this:
Table:
LOAD Metric,
Date(Date#(Date, 'MMM YYYY'), 'MMM YYYY') as Date,
Figure;
LOAD * INLINE [
Metric, Date, Figure
Metric 1, Aug 2016, 10
Metric 1, Sep 2016, 0
Metric 1, Oct 2016, 0
Metric 1, Nov 2016, 25
Metric 1, Dec 2016, 35
];
FinalTable:
LOAD Metric,
Date,
Figure,
NewFigure,
If(Metric = Previous(Metric) and Date = AddMonths(Previous(Date), 1), RangeSum(NewFigure, -Peek('NewFigure')), NewFigure) as NonCumFigure;
LOAD Metric,
Date,
Figure,
If(Metric = Previous(Metric) and Date = AddMonths(Previous(Date), 1), If(Figure = 0, Peek('NewFigure'), Figure), Figure) as NewFigure
Resident Table;
DROP Table Table;