Unlock a world of possibilities! Login now and discover the exclusive benefits awaiting you.
- Qlik Community
- :
- All Forums
- :
- QlikView App Dev
- :
- Re: Trending line chart with threshold indicator
- Subscribe to RSS Feed
- Mark Topic as New
- Mark Topic as Read
- Float this Topic for Current User
- Bookmark
- Subscribe
- Mute
- Printer Friendly Page
- Mark as New
- Bookmark
- Subscribe
- Mute
- Subscribe to RSS Feed
- Permalink
- Report Inappropriate Content
Trending line chart with threshold indicator
Team,
just I want to do the trending line chart using condition as for example.
1.i having one trending line chart if the line crosses the threshold point then should generate the bar.
The threshold value may like 500.please refer the below screenshots.
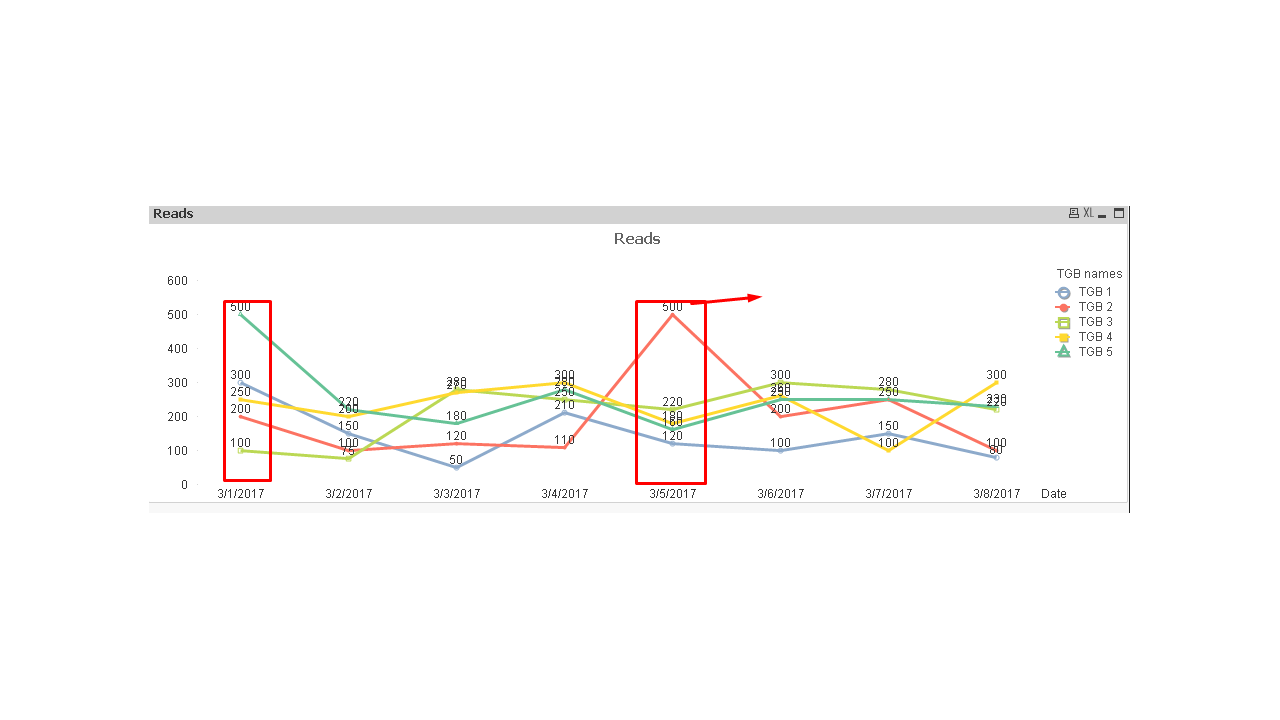
Note: In the above screenshots the threshold value is 500 if the line crossed the 500 then generate the bar chart.
I request to everyone please reply.
Thanks,
Irshad Ahmad.
- « Previous Replies
-
- 1
- 2
- Next Replies »
- Mark as New
- Bookmark
- Subscribe
- Mute
- Subscribe to RSS Feed
- Permalink
- Report Inappropriate Content
Ref, PFA
- Mark as New
- Bookmark
- Subscribe
- Mute
- Subscribe to RSS Feed
- Permalink
- Report Inappropriate Content
Anil Thanks for the reply but I could not get nay attached file.could you please attached the file so that I can access.
Thanks,
Irshad Ahmad
- Mark as New
- Bookmark
- Subscribe
- Mute
- Subscribe to RSS Feed
- Permalink
- Report Inappropriate Content
Attachment is visible to me, You are not?
- Mark as New
- Bookmark
- Subscribe
- Mute
- Subscribe to RSS Feed
- Permalink
- Report Inappropriate Content
Thanks Anil for quick response.
- Mark as New
- Bookmark
- Subscribe
- Mute
- Subscribe to RSS Feed
- Permalink
- Report Inappropriate Content
Anil when i am clicking the your qvw file it is opening only PNG format.could you please check it.
- Mark as New
- Bookmark
- Subscribe
- Mute
- Subscribe to RSS Feed
- Permalink
- Report Inappropriate Content
Anil when I am clicking your QVW file it is opening only PNG format.could you please check it.
- Mark as New
- Bookmark
- Subscribe
- Mute
- Subscribe to RSS Feed
- Permalink
- Report Inappropriate Content
Look at first response by Anil, there you have the qvw file attached?
- Mark as New
- Bookmark
- Subscribe
- Mute
- Subscribe to RSS Feed
- Permalink
- Report Inappropriate Content
No vishwarath I could not get the QVW file which was shared by Anil.
- Mark as New
- Bookmark
- Subscribe
- Mute
- Subscribe to RSS Feed
- Permalink
- Report Inappropriate Content
Here you go Again
- « Previous Replies
-
- 1
- 2
- Next Replies »