Unlock a world of possibilities! Login now and discover the exclusive benefits awaiting you.
- Qlik Community
- :
- All Forums
- :
- QlikView App Dev
- :
- Re: Tricky Aggregation in top 10 Values
- Subscribe to RSS Feed
- Mark Topic as New
- Mark Topic as Read
- Float this Topic for Current User
- Bookmark
- Subscribe
- Mute
- Printer Friendly Page
- Mark as New
- Bookmark
- Subscribe
- Mute
- Subscribe to RSS Feed
- Permalink
- Report Inappropriate Content
Tricky Aggregation in top 10 Values
Hello Guys here i have a special requirement ,
I have the following fields
ID , country, region, Cust_cd and year, Sales
Here i want to calculate top 10 customers vs Other customers based on year and country
my formula is
=sum({<Cust_cd={$(=concat(if(aggr(rank(sum(sales),4),cust_cd)<=10,chr(39)&Cust_cd&chr(39)),','))}>}Sales)
and in a bar chart i am taking year and Country as Diemensions ,
when i made any selections on seperate list boxes country and year , then only it is giving correct values,
if i did not select any value then it is showing some other values ,
the problem i have identified is when taking top 10 cust_cd , for the first time it is taking based on total COUNTRY field,
if you select a specific country then only it is showing top 10 values in that country,
as i am taking country as dimension , the chart has to show top 10 valeus accordingly ,
can you guys please help in sloving this problem , please let me know where i am doing mistake ...
Thanks
Sasi
- « Previous Replies
-
- 1
- 2
- Next Replies »
- Mark as New
- Bookmark
- Subscribe
- Mute
- Subscribe to RSS Feed
- Permalink
- Report Inappropriate Content
View attached sample. Replace the inline data with more lines if necessary or replace the Company and Region with familiar names.
- Mark as New
- Bookmark
- Subscribe
- Mute
- Subscribe to RSS Feed
- Permalink
- Report Inappropriate Content
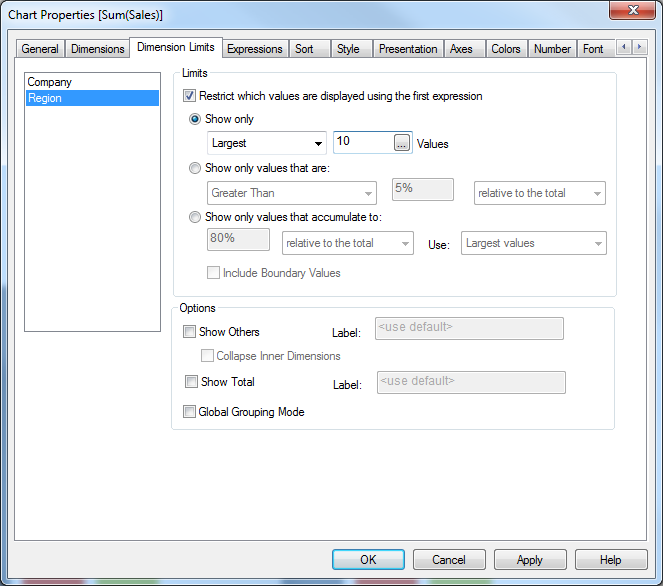
Why don't you try limiting the Dimension by Largest 10 and the expression is the Region Sales only.
If this helped you, please mark as Helpful. If it solves your issue, please mark as Answer
Regards
Dhruv
- « Previous Replies
-
- 1
- 2
- Next Replies »