Unlock a world of possibilities! Login now and discover the exclusive benefits awaiting you.
- Qlik Community
- :
- All Forums
- :
- QlikView App Dev
- :
- Trigger on Straight table Expression Values
- Subscribe to RSS Feed
- Mark Topic as New
- Mark Topic as Read
- Float this Topic for Current User
- Bookmark
- Subscribe
- Mute
- Printer Friendly Page
- Mark as New
- Bookmark
- Subscribe
- Mute
- Subscribe to RSS Feed
- Permalink
- Report Inappropriate Content
Trigger on Straight table Expression Values
Hi Guys,
I have a requirement in straight table.The scrren shot of the table is given below.
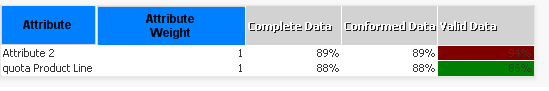
Now the requiremnt is when i click on the complete data or conformed data values (89%,88% ..), another chart shold be opened.
How can I do that..? There is no trigger I can set when click on the column values. I cannot do this with an invisible text object as the data in the straight table will be growing each day.
Any help would be greatly appreciated.
Thanks and Regards,
Praveena
- Mark as New
- Bookmark
- Subscribe
- Mute
- Subscribe to RSS Feed
- Permalink
- Report Inappropriate Content
Hi Praveena,
Please have a look the thread below.
http://community.qlik.com/thread/73526
Hope it helps you out.
Download the ConditionalPivot.qvw and explore it.
Regards,
Ram
- Mark as New
- Bookmark
- Subscribe
- Mute
- Subscribe to RSS Feed
- Permalink
- Report Inappropriate Content
Hi Ram,
Thank you for your quick reply.
I am trying to have the same kind of chart for me as well.
The chart which pops up on click is conditional and the condition used is len(unique_id)<>0.
same way when I tried for len(completeness), which is always 0 because of which the chart does not come up.
I am attaching my application.
Can you please have a look.?
Thanks and Regards,
Praveena