Unlock a world of possibilities! Login now and discover the exclusive benefits awaiting you.
- Qlik Community
- :
- All Forums
- :
- QlikView App Dev
- :
- Re: Trying to add a line into a stacked bar chart ...
- Subscribe to RSS Feed
- Mark Topic as New
- Mark Topic as Read
- Float this Topic for Current User
- Bookmark
- Subscribe
- Mute
- Printer Friendly Page
- Mark as New
- Bookmark
- Subscribe
- Mute
- Subscribe to RSS Feed
- Permalink
- Report Inappropriate Content
Trying to add a line into a stacked bar chart without it unstacking
Hi,
I have attached file showing a stacked bar chart, I would like to add a threshold line based on Product = 'Type A' and Group = 'Group A'.
The expression will carry an IF clause to filter the Product and a List box will cover the selection of Groups.
My issue is when I enable the expression to put a line on the chart, the bars dont stack anymore. How can the line be added without un stacking the data.
The line should be 5.
Thanks
- Tags:
- new_to_qlikview
- Mark as New
- Bookmark
- Subscribe
- Mute
- Subscribe to RSS Feed
- Permalink
- Report Inappropriate Content
Have you tried using Reference Lines on the Presentation tab? You can use Calculated Expression for this line (For the sake of the example, I just used a static number 5)
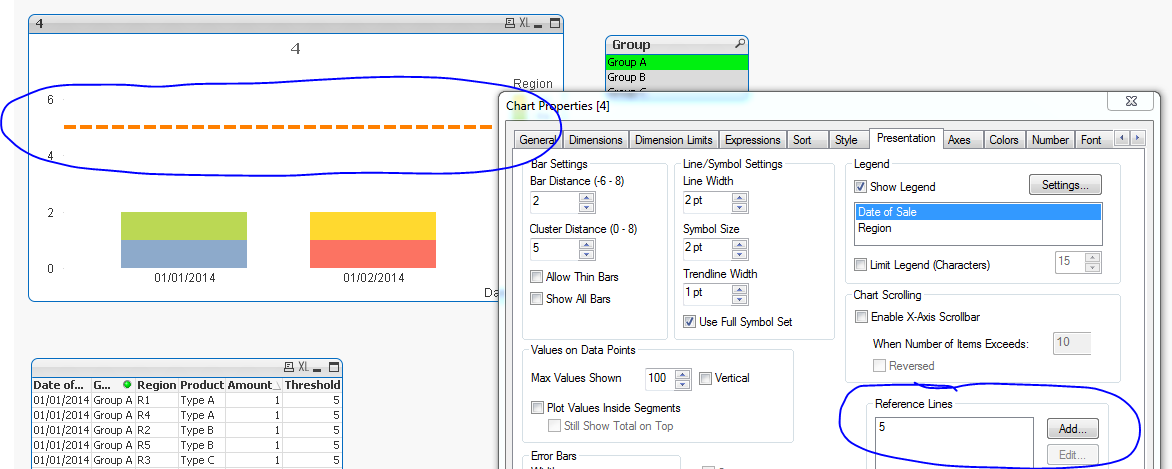
Note: I used a static max of 7 so that the line was visible at 5
- Mark as New
- Bookmark
- Subscribe
- Mute
- Subscribe to RSS Feed
- Permalink
- Report Inappropriate Content
Is that you need?

- Mark as New
- Bookmark
- Subscribe
- Mute
- Subscribe to RSS Feed
- Permalink
- Report Inappropriate Content
Yes thats what I need, but the Threshold could change every month and I want it to be set from the upload file not from QV.
Thanks
- Mark as New
- Bookmark
- Subscribe
- Mute
- Subscribe to RSS Feed
- Permalink
- Report Inappropriate Content
Like I mentioned you can use an expression to determine the positioning of the line. Can you elaborate on the calculation that drives the threshold here?
- Mark as New
- Bookmark
- Subscribe
- Mute
- Subscribe to RSS Feed
- Permalink
- Report Inappropriate Content
Hi,
Check this,
HTH,
Hirish
- Mark as New
- Bookmark
- Subscribe
- Mute
- Subscribe to RSS Feed
- Permalink
- Report Inappropriate Content
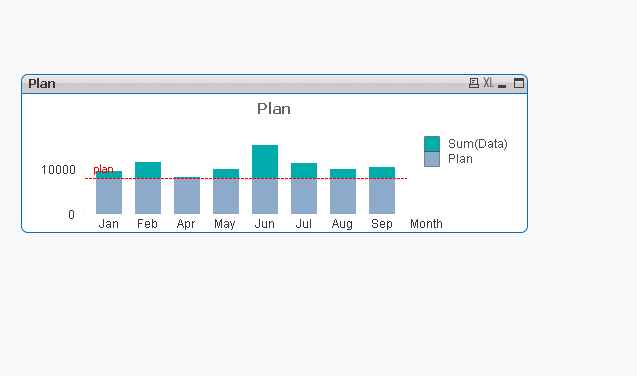
If your regions are somewhat fixed (few regions wich doesn't changes) you can leave only one dimension and create an expression for each of the regions.
With only one dimension you can have your bars stacked and the line as an expression wich can vary.
- Mark as New
- Bookmark
- Subscribe
- Mute
- Subscribe to RSS Feed
- Permalink
- Report Inappropriate Content
you would want to create/use an expression as a reference line on the presentation tab - by using an expression isntead of a hard code value, your line will by dynamic, based on the data within the expression
- Mark as New
- Bookmark
- Subscribe
- Mute
- Subscribe to RSS Feed
- Permalink
- Report Inappropriate Content
OK great I have it now, I will repost my QVD for reference.