Unlock a world of possibilities! Login now and discover the exclusive benefits awaiting you.
- Qlik Community
- :
- All Forums
- :
- QlikView App Dev
- :
- Trying to use set analysis to show baseline value ...
- Subscribe to RSS Feed
- Mark Topic as New
- Mark Topic as Read
- Float this Topic for Current User
- Bookmark
- Subscribe
- Mute
- Printer Friendly Page
- Mark as New
- Bookmark
- Subscribe
- Mute
- Subscribe to RSS Feed
- Permalink
- Report Inappropriate Content
Trying to use set analysis to show baseline value in pivot
Hi,
I'm having trouble to get my set analysis to work in a pivot tabel in Qlikview.
In my test application I have 6 companies showing EBIT values for each year starting from 2004.
In a variable (vBaseLineYear) I want to provide the baseline year and have the value of that year shown in my pivot.
However, when using this expression: sum({<Year={$(vBaseLineYear)}>} EBIT)
It will only show the value of the baseline year as follows in this example (where vBaseLineYear = 2007):
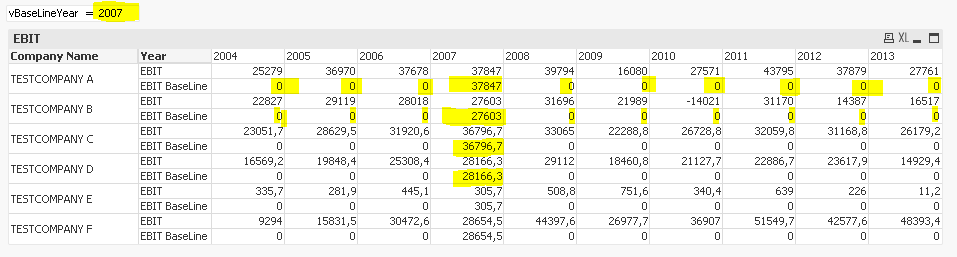
It will only calculate when it is actually the baseline year and not with the other years.
The problem seems to be not so much the variable, but rather the using of my set analysis in combination with this pivot set up.
Any advice would be greatly appreciated.
Accepted Solutions
- Mark as New
- Bookmark
- Subscribe
- Mute
- Subscribe to RSS Feed
- Permalink
- Report Inappropriate Content
I think that should be fairly easy. Add the Total keyword like this:
=sum({<Year={$(vBaseLineYear)}>}TOTAL<[Company Name]> EBIT)
-Rob
- Mark as New
- Bookmark
- Subscribe
- Mute
- Subscribe to RSS Feed
- Permalink
- Report Inappropriate Content
Your displayed results make sense to me, so I believe I may be misunderstanding your objective. For the expression "EBIT Baseline", the other years show zero because of the SET expression, which is expected. For the "EBIT" expression, the values show for the other years.
Are you trying to fold this in to one line and somehow indicate the baseline year like with a different background color?
-Rob
- Mark as New
- Bookmark
- Subscribe
- Mute
- Subscribe to RSS Feed
- Permalink
- Report Inappropriate Content
Hi,
try this: =Sum({$<Year={"$(vBaseLineYear)"}>}Ebit)
T.
- Mark as New
- Bookmark
- Subscribe
- Mute
- Subscribe to RSS Feed
- Permalink
- Report Inappropriate Content
I think you could do it with alternate state. You would have to assign the vBaseLine alternate state 2 and the same also use within your set analysis.
T.
- Mark as New
- Bookmark
- Subscribe
- Mute
- Subscribe to RSS Feed
- Permalink
- Report Inappropriate Content
Hi, I've made a screenshot of what I'm trying to accomplish. I might not have been clear since the results make sense to you:
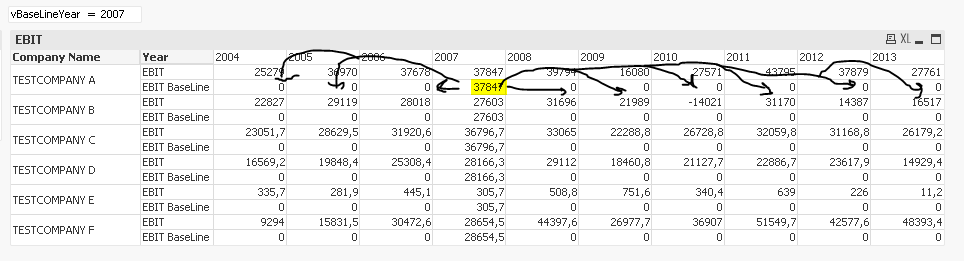
I want the chosen baselineyear value for each company put underneath the EBIT value of each year.
So right now in above example for row 'TESTCOMPANY A' it gives 0 for each column (2004, 2005, etc) except year 2007. But I want that value '37847' to be displayed in each year for 'TESTCOMPANY A'
For the other rows ('TESTCOMPANY B ... F') I want these results.
This meanshaving value:
'27603' in each 'EBIT BaseLine' column for TESTCOMPANY B
'36796,7' in each 'EBIT BaseLine' column for TESTCOMPANY C
etc.
etc.
Hope this makes my intention clear.
Thank you in advance.
- Mark as New
- Bookmark
- Subscribe
- Mute
- Subscribe to RSS Feed
- Permalink
- Report Inappropriate Content
I think that should be fairly easy. Add the Total keyword like this:
=sum({<Year={$(vBaseLineYear)}>}TOTAL<[Company Name]> EBIT)
-Rob
- Mark as New
- Bookmark
- Subscribe
- Mute
- Subscribe to RSS Feed
- Permalink
- Report Inappropriate Content
Whoa! That was it!
I feel weird having overlooked this, but many thanks!