Unlock a world of possibilities! Login now and discover the exclusive benefits awaiting you.
- Qlik Community
- :
- All Forums
- :
- QlikView App Dev
- :
- Re: Two Databases | Seperated by Date
- Subscribe to RSS Feed
- Mark Topic as New
- Mark Topic as Read
- Float this Topic for Current User
- Bookmark
- Subscribe
- Mute
- Printer Friendly Page
- Mark as New
- Bookmark
- Subscribe
- Mute
- Subscribe to RSS Feed
- Permalink
- Report Inappropriate Content
Two Databases | Seperated by Date
on my chart as of this date count all the records from the DB1 and from this date count the records from DB2.eg:-
Cut off date is June 25th,2014.If one clicks on 2014 ( filter based on year from date dimension) to find how many orders for 2014 then it should be give 100 and at the same time if I click on July 2014 it should populate all the records from Jan 1st to July 30 but certainly not only the July data...ie I need as of July how many orders had been completed...
any help is appreciated.
- Tags:
- new_to_qlikview
- Mark as New
- Bookmark
- Subscribe
- Mute
- Subscribe to RSS Feed
- Permalink
- Report Inappropriate Content
Hi Venkat,
I think you are trying to calculate YTD. Year to date analysis.. Refer this YTQ, QTD, MTD and WTD
- Mark as New
- Bookmark
- Subscribe
- Mute
- Subscribe to RSS Feed
- Permalink
- Report Inappropriate Content
Thanks for the doc.. My data is wrong when i try to roll it up...
=COUNT({<Years=, Month=, Quarter=, Week=, EFFDT=, Date={">=$(=Num(MonthStart(Max(Date))))<=$(=Max(Date))"}>} DISTINCT(orders)) ..
any help is appreciated..
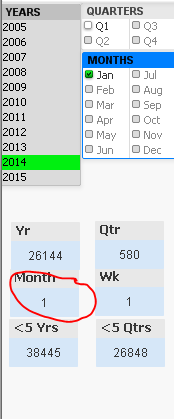
eg:- Once i clicked on 2014 the month records are showing up as 187 but when i click on the 2014 Jan the month records scrolls down to 1
am i making any sense or completely doing the wrong way?
thanks for your help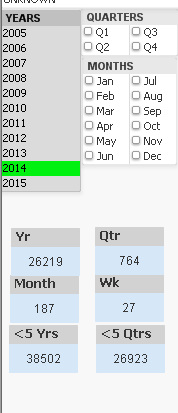
- Mark as New
- Bookmark
- Subscribe
- Mute
- Subscribe to RSS Feed
- Permalink
- Report Inappropriate Content
I have a issue with Point in time data using Set Analysis.It does not show up the right info even thou the logic is correct...Any help is appreciated.
- Mark as New
- Bookmark
- Subscribe
- Mute
- Subscribe to RSS Feed
- Permalink
- Report Inappropriate Content
It would be very helpful if you could prepare and post an example document that shows this erroneous behavior.
- Mark as New
- Bookmark
- Subscribe
- Mute
- Subscribe to RSS Feed
- Permalink
- Report Inappropriate Content
are you talking about QVD? If yes,i need to trim down values as it does have lots of rows...
Here is the example for the Point in Time of the year.
EFFDT is the date coming in from date dimension : Date(TempDate,'MM/DD/YYYY') as EFFDT, : which is tied to date in most of the tables:
Emplid is the no of employees based on effective dates
=Count({<Years=, Month=, Quarter=, Week=, EFFDT=, Date={">=$(=Num(YearStart(Max(Date))))<=$(=Max(Date))"}>} distinct(EMPLID))
req: if my 2014 active employees is 200 but on jan 15th the active employees is 10,and jan 30th is I have 23 employees active and as a whole I have for jan I have 28 (considering some left) so when I click on jan it should show 28 rather 33.
thinking of intervalmatch (will it be effective) than set analysis
- Mark as New
- Bookmark
- Subscribe
- Mute
- Subscribe to RSS Feed
- Permalink
- Report Inappropriate Content
No, I'm talking about a QVW.
- Mark as New
- Bookmark
- Subscribe
- Mute
- Subscribe to RSS Feed
- Permalink
- Report Inappropriate Content
Hi Venkat,
Post your qvw if possible, or post some model with the same structure and clearly post your problem. Many experts are ready in answering to freshers like us. So kindly post your problem with a model qvw
- Mark as New
- Bookmark
- Subscribe
- Mute
- Subscribe to RSS Feed
- Permalink
- Report Inappropriate Content
I am trying to do a Intervalmatch to get a solution...testing it...:)