Unlock a world of possibilities! Login now and discover the exclusive benefits awaiting you.
- Qlik Community
- :
- All Forums
- :
- QlikView App Dev
- :
- Re: Two different color in single bar in barchart
- Subscribe to RSS Feed
- Mark Topic as New
- Mark Topic as Read
- Float this Topic for Current User
- Bookmark
- Subscribe
- Mute
- Printer Friendly Page
- Mark as New
- Bookmark
- Subscribe
- Mute
- Subscribe to RSS Feed
- Permalink
- Report Inappropriate Content
Two different color in single bar in barchart
Dear All,
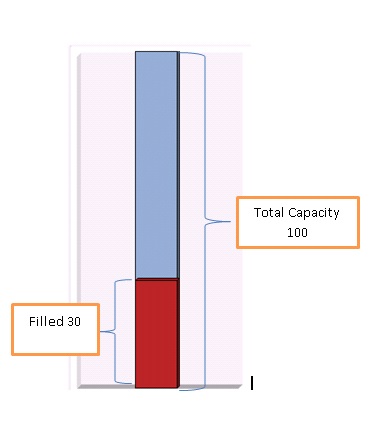
My requirement is, i want to show two values in single bar chart with different colors like below.
I have two expression fields capacity &used and single dimension field container.
Say for example the container A ( My dimension ) of capacity 100% is filled with 30%.I want to differentiate the bar in two colors.
100 should be in one color and in that 30 should be in an another color ( like color in color in single bar ) Like below.
Thanks in advance
- « Previous Replies
-
- 1
- 2
- Next Replies »
- Mark as New
- Bookmark
- Subscribe
- Mute
- Subscribe to RSS Feed
- Permalink
- Report Inappropriate Content
May be it would be easier to understand what you are trying to do if you can share a sample? Because as per your description, it seems like what I have proposed seem to work. I don't know how would it matter if we use one way or the other if the final output looks the same. But I may be missing something important 
- Mark as New
- Bookmark
- Subscribe
- Mute
- Subscribe to RSS Feed
- Permalink
- Report Inappropriate Content
send me code this process
- « Previous Replies
-
- 1
- 2
- Next Replies »