Unlock a world of possibilities! Login now and discover the exclusive benefits awaiting you.
- Qlik Community
- :
- All Forums
- :
- QlikView App Dev
- :
- Re: Two dimensions in Bar Chart
- Subscribe to RSS Feed
- Mark Topic as New
- Mark Topic as Read
- Float this Topic for Current User
- Bookmark
- Subscribe
- Mute
- Printer Friendly Page
- Mark as New
- Bookmark
- Subscribe
- Mute
- Subscribe to RSS Feed
- Permalink
- Report Inappropriate Content
Two dimensions in Bar Chart
Hi,
I have countries and cites in two fields. and want to have a graph with countries and cities as dimensions and sales as expression.
I want to have a bar chart with both dimensions in X-Axsis. I have created calculated dimension as 1 and then i can do that.
But my x-asis shows all the cities for all counties.
Eg- I have two countries, USA and ENGLAND
and cities as Newyork, Florida, London , Liverpool.
so my x axis show Newyork, Florida, London , Liverpool for both cities.
But i want to have it as Newyork, Florida under USa and London , Liverpool under London
- Tags:
- new_to_qlikview
- Mark as New
- Bookmark
- Subscribe
- Mute
- Subscribe to RSS Feed
- Permalink
- Report Inappropriate Content
drill down doesn't show both dimenssion in one time
- Mark as New
- Bookmark
- Subscribe
- Mute
- Subscribe to RSS Feed
- Permalink
- Report Inappropriate Content
That Depends on the data relation between these two fields CITY and COUNTRY,
If possible post your qvw or sample data
- Mark as New
- Bookmark
- Subscribe
- Mute
- Subscribe to RSS Feed
- Permalink
- Report Inappropriate Content
You can use Grid chart for same as it take two dimension
- Mark as New
- Bookmark
- Subscribe
- Mute
- Subscribe to RSS Feed
- Permalink
- Report Inappropriate Content
Please see attached
- Mark as New
- Bookmark
- Subscribe
- Mute
- Subscribe to RSS Feed
- Permalink
- Report Inappropriate Content
see attached
- Mark as New
- Bookmark
- Subscribe
- Mute
- Subscribe to RSS Feed
- Permalink
- Report Inappropriate Content
HI,
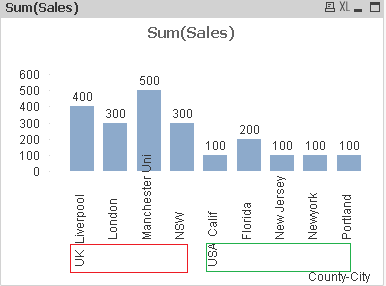
I am not sure I understand what you are wanting? I have had a look at the data and created the graph and break down with the cities above the countries. Could you please explain what you want differently on the screen capture below.
Mark
- Mark as New
- Bookmark
- Subscribe
- Mute
- Subscribe to RSS Feed
- Permalink
- Report Inappropriate Content
No, I want both deminsons in x axsis
- Mark as New
- Bookmark
- Subscribe
- Mute
- Subscribe to RSS Feed
- Permalink
- Report Inappropriate Content
In Bar chart, Its not possible to plot both the value on same axis at same time .
.
You can try Block/Mekko chart..
- Mark as New
- Bookmark
- Subscribe
- Mute
- Subscribe to RSS Feed
- Permalink
- Report Inappropriate Content
Hi,
There are, You have the country and cities on the x-axis and then sum of sales on the y-axis?
Are you meaning you want to to see separate bars for the sum of sales for the counties on the same graph?
I think like Balraj below says it is not possible.
Mark
- Mark as New
- Bookmark
- Subscribe
- Mute
- Subscribe to RSS Feed
- Permalink
- Report Inappropriate Content
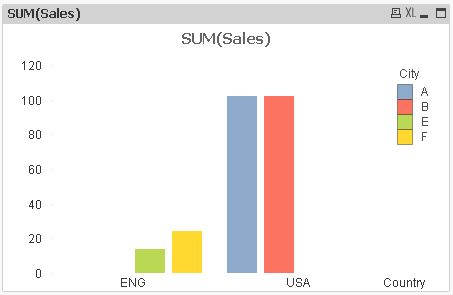
May be like in attached sample. A workaround.