Unlock a world of possibilities! Login now and discover the exclusive benefits awaiting you.
- Qlik Community
- :
- All Forums
- :
- QlikView App Dev
- :
- Two dimensions in one dimension for country and ge...
- Subscribe to RSS Feed
- Mark Topic as New
- Mark Topic as Read
- Float this Topic for Current User
- Bookmark
- Subscribe
- Mute
- Printer Friendly Page
- Mark as New
- Bookmark
- Subscribe
- Mute
- Subscribe to RSS Feed
- Permalink
- Report Inappropriate Content
Two dimensions in one dimension for country and gender
Hi All,
I am trying to create a data model, creating a dimension with joining two dimensions
eg: created country dimension by joining trainer country and student country.
created a bar chart with student count
when I tried to filtering by country filter its showing wrong student count(Expected 3 and Actual 7)
Same goes with Trainer Gender and Student Gender, I want to create Gender dimension.
Please see attached excel data, any help will be appreciated.
Thanks
Nitha
- Mark as New
- Bookmark
- Subscribe
- Mute
- Subscribe to RSS Feed
- Permalink
- Report Inappropriate Content
Can send us a screen shot of your expected output or what figures are you actually expecting?
- Mark as New
- Bookmark
- Subscribe
- Mute
- Subscribe to RSS Feed
- Permalink
- Report Inappropriate Content
Try this and let me know what you get?
Table1:
LOAD TrainerName, TrainerCountry & '-' & StudentCountry AS TrainerStudCountry, TrainerCountry, TrainerGender, StudentCountry, StudentGender,
StudentName, TrainerGender & '-' & StudentGender AS TrainerStudGen;
LOAD [Trainer Name] AS TrainerName,
[Trainer Country] AS TrainerCountry,
[Trainer Gender] AS TrainerGender,
[Student Name] AS StudentName,
[Student Country] AS StudentCountry,
[Student Gender] AS StudentGender
FROM
[..\Desktop\Two dimension into one dimension example.xlsx]
(ooxml, embedded labels, table is Sheet1);
- Mark as New
- Bookmark
- Subscribe
- Mute
- Subscribe to RSS Feed
- Permalink
- Report Inappropriate Content
Hi Vishwarath,
Thanks for quick response.
Below is the output for my requirement
| Trainer Country | Trainer Count for each country | Trainer count filter by male gender | Trainer count filter by female gender |
| Poland | 4 | 3 | 1 |
| Australia | 4 | 2 | 2 |
| Canada | 4 | 2 | 2 |
| America | 4 | 0 | 4 |
| Student Country | Student Count for each country | student count filter by male gender | Student count filter by male gender |
| America | 3 | 2 | 1 |
| Australia | 3 | 2 | 1 |
| Canada | 3 | 2 | 1 |
| England | 1 | 0 | 1 |
| India | 1 | 0 | 1 |
| Japan | 1 | 1 | 0 |
| Luxemberg | 1 | 1 | 0 |
| Poland | 2 | 0 | 2 |
| Rio | 1 | 1 | 0 |
When I select country America count for student chart should be 3, instead its 7.
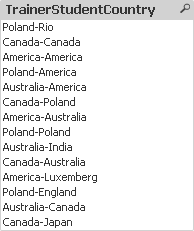
and as for your solution, i get below display for TrainerStudentCountry field.

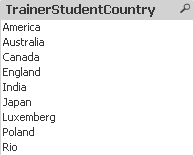
But i want the display in UI:

Regards
Nitha
- Mark as New
- Bookmark
- Subscribe
- Mute
- Subscribe to RSS Feed
- Permalink
- Report Inappropriate Content
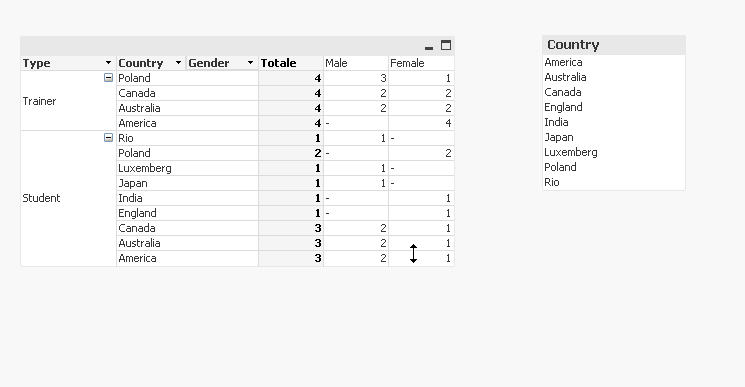
Result in a pivot table with expression
count( Id)

The script is
Table:
LOAD [Trainer Name],
[Trainer Country],
[Trainer Gender],
[Student Name],
[Student Country],
[Student Gender],
rowno() as Id
FROM
[Two dimension into one dimension example.xlsx]
(ooxml, embedded labels, table is Sheet1);
Type:
LOAD Distinct Id, [Student Country] as Country, 'Student' as Type, [Student Gender] as Gender, 'Student' as GenderType
Resident Table;
LOAD Id, [Trainer Country] as Country, 'Trainer' as Type, [Trainer Gender] as Gender, 'Trainer' as GenderType
Resident Table;
DROP Field [Trainer Country], [Trainer Gender], [Student Country], [Student Gender];