Unlock a world of possibilities! Login now and discover the exclusive benefits awaiting you.
- Qlik Community
- :
- All Forums
- :
- QlikView App Dev
- :
- Units of measure on a graph
- Subscribe to RSS Feed
- Mark Topic as New
- Mark Topic as Read
- Float this Topic for Current User
- Bookmark
- Subscribe
- Mute
- Printer Friendly Page
- Mark as New
- Bookmark
- Subscribe
- Mute
- Subscribe to RSS Feed
- Permalink
- Report Inappropriate Content
Units of measure on a graph
Does anyone know if you can change the units of measure on a graph somehow?
If all my units of measures were in Liters but I wanted to see them in thousands of liters to make the graph look better...is that possible in just the graph itself?
- Mark as New
- Bookmark
- Subscribe
- Mute
- Subscribe to RSS Feed
- Permalink
- Report Inappropriate Content
The easiest way that I know is dividing your expression's result by 1000 and add to the chart a fixed text saying something like "Valeus in thousands of liters".
Regards,
Gabriel
- Mark as New
- Bookmark
- Subscribe
- Mute
- Subscribe to RSS Feed
- Permalink
- Report Inappropriate Content
Use Number tab
- Mark as New
- Bookmark
- Subscribe
- Mute
- Subscribe to RSS Feed
- Permalink
- Report Inappropriate Content
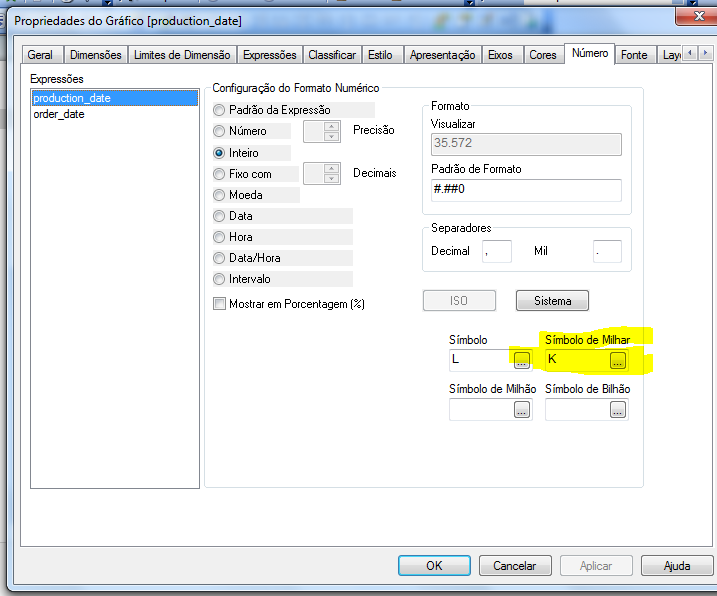
On the numbers tab of the chart properties you can set:
Symbol, e.g. Liters
Thousand Symbol, e.g. '000 Liters
Million Symbol, e.g. MUSD
Billion Symbol, e.g. BUSD
QlikView will then use the Symbols if possible. That is 100 => 100 Liters and 15 000 => 15 '000 Liters etc.
I prefer to do it through a variable, so that it easily changed if needed, or combined with a currency code in some currency Field. E.g. ='K'&Currency
Good luck.
Kind regards
Niklas