Unlock a world of possibilities! Login now and discover the exclusive benefits awaiting you.
- Qlik Community
- :
- All Forums
- :
- QlikView App Dev
- :
- Re: Re: Use dynamically the backgroung colours ? H...
Options
- Subscribe to RSS Feed
- Mark Topic as New
- Mark Topic as Read
- Float this Topic for Current User
- Bookmark
- Subscribe
- Mute
- Printer Friendly Page
Turn on suggestions
Auto-suggest helps you quickly narrow down your search results by suggesting possible matches as you type.
Showing results for
Not applicable
2013-11-18
10:24 AM
- Mark as New
- Bookmark
- Subscribe
- Mute
- Subscribe to RSS Feed
- Permalink
- Report Inappropriate Content
Use dynamically the backgroung colours ? How?
Hi all,
I have this table:
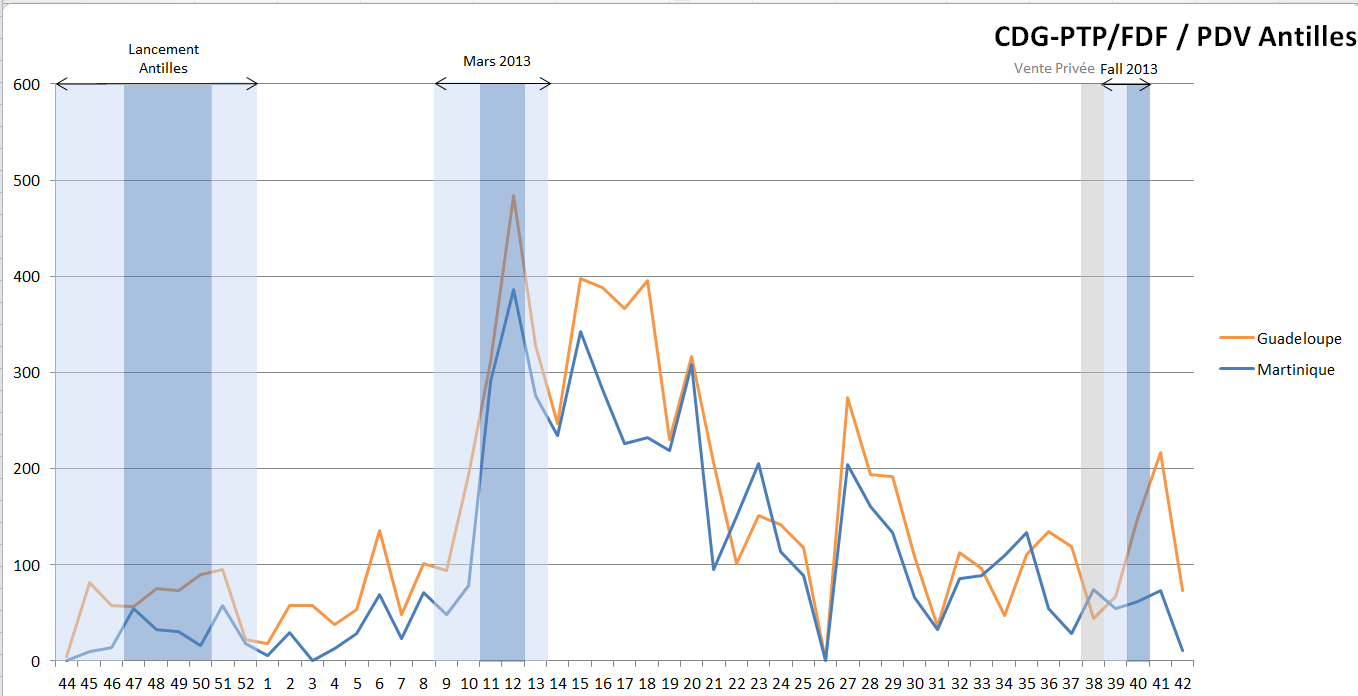
| CITY | date (=axe X) | Volume (=axe Y) | Type Marketing |
|---|---|---|---|
| AAA | 01/01/2013 | 300 | Light Blue |
| AAA | 02/01/2013 | 250 | Dark Blue |
| AAA | 03/01/2013 | 150 | Light Blue |
| BBB | 01/01/2013 | 275 | |
| BBB | 02/02/2013 | 55 | Light Blue |
| BBB | 03/01/2013 | 145 | DarkBlue |
The lines represent the "Volume" data and the color of graph background represents the "Type Marketing" Data.
The background colours depend of the value containt by the field "Type Marketing".
How can i make it ?
Many thanks !
403 Views
2 Replies
Employee
2013-11-18
10:28 AM
- Mark as New
- Bookmark
- Subscribe
- Mute
- Subscribe to RSS Feed
- Permalink
- Report Inappropriate Content
Background color is a parameter per graph, you can´t have this by value.
280 Views
Employee
2013-11-18
10:33 AM
- Mark as New
- Bookmark
- Subscribe
- Mute
- Subscribe to RSS Feed
- Permalink
- Report Inappropriate Content
A workaround could be having two bar graphs positioned one on top of other.
PFA
280 Views